Sommaire
- TECNativePlaceLayer
- XapiLayer
- Way
- Recherche manuelle
- Mapillary
- TECMapillaryLayer
- Searchimageclose
- Heatmap
- Weather Layer
- TomTom Traffic Incidents
- Layer OverPassApi
- Bubble Layer
- TECBubbleLayers
- TECBubbleLayer
- Chart Layer
- TECChartLayers
- TECCharLayer
- AirQuality
- Layer WMS
- TECOverlayWMS
- Layer WFS
- General Transit Feed Specification
TECNativeLayer est la classe de base des layers qui vous permettent de réagir en fonction de la zone affichée et des actions de la souris.
TECNativeLayer = class
private
FObserver : TNativeMapObserver;
FShapes : TECShapes;
FMap : TNativeMapControl;
FOnShapeRightClick,
FOnShapeClick : TOnShapeMouseEvent;
FOnMouseClick,
FOnMouseMove : TNotifyEvent;
function getMinZoom :
byte;
function getMaxZoom :
byte;
procedure
setMinZoom(value:byte);
procedure
setMaxZoom(value:byte);
function getVisible :
boolean;
protected
procedure
doOnMapEndMove(sender : TObject); virtual;
procedure
doOnShapeClick(sender : TObject); virtual;
procedure
doOnShapeRightClick(sender : TObject); virtual;
procedure
doOnMapMouseMove(sender : TObject); virtual;
procedure
doOnMapMouseClick(sender : TObject); virtual;
procedure
doOnMapHiResChange(sender : TObject); virtual;
public
procedure
setVisible(const
value:boolean); virtual;
constructor
Create(_FMap:TnativeMapControl;const Name:string); virtual;
destructor Destroy;
override;
property OnShapeClick :
TOnShapeMouseEvent read
FOnShapeClick write
FOnShapeClick;
property OnShapeRightClick :
TOnShapeMouseEvent read
FOnShaperightClick write
FOnShapeRightClick;
property OnMouseMove :
TNotifyEvent read
FOnMouseMove write
FOnMouseMove;
property OnMouseClick :
TNotifyEvent read
FOnMouseClick write
FOnMouseClick;
property Map :
TNativeMapControl read
FMap;
property Shapes : TECShapes
read FShapes;
property Visible : boolean
read getVisible write setVisible;
property MaxZoom : byte
read getMaxZoom write setMaxZoom;
property MinZoom : byte
read getMinZoom write setMinZoom;
end;
TECNativePlaceLayer
Vous permet d'afficher automatiquement le résultat d'une recherche
Pour utiliser ce layer vous devez incorporer l'unité uecNativePlaceLayer ou FMX.uecNativePlaceLayer selon que vous utilisiez la version VCL ou FireMonkey
1Exemple : un layer qui affiche les restaurants
// search
Layer
FPlacesLayer :=
TECNativePlaceLayer.create(map,'PLACES_LAYER');
FPlacesLayer.OnPLaceClick := doOnPlaceClick;
FPlacesLayer.Visible := true;
FPlacesLayer.Search := 'node[amenity=restaurant]';
// standard image
32x32
FPlacesLayer.MarkerFilename := 'http://www.helpandweb.com/cake_32.png';
// lat,lng on center of
image
FPlacesLayer.XAnchor := 16;
FPlacesLayer.YAnchor := 16;
// hi-res image 64*64
FPlacesLayer.MarkerHiResFilename := 'http://www.helpandweb.com/cake_64.png';
// lat,lng on center of
image
FPlacesLayer.HiResXAnchor := 32;
FPlacesLayer.HiResYAnchor := 32;
...
// event click on place
shape
procedure
TForm1.doOnPlaceClick(sender : TECShape);
var
pResult : TECPlaceResult;
r,
n,
Content : string;
i : integer;
begin
// here Sender and Sender.Item are
allway assigned, and Sender.Item is
TECPlaceResult
pResult :=TECPlaceResult(Sender.item)
for i:=0 to pResult.CountResult-1 do
begin
n := pResult.NameResult[i];
r := pResult.Result[n];
if length(n)<
9 then
n := n+'<tab="65">';
content := content+'<b>'+n+'</b>: '+r+'<br>';
end;
if
FPlacesLayer.Shapes.InfoWindows.Count=0 then
begin
FPlacesLayer.Shapes.InfoWindows.add(0,0,'');
FPlacesLayer.Shapes.InfoWindows[0].zindex := 100;
end;
FPlacesLayer.Shapes.InfoWindows[0].content := Content;
FPlacesLayer.Shapes.InfoWindows[0].SetPosition(Shape.Latitude,shape.Longitude);
FPlacesLayer.Shapes.InfoWindows[0].Visible := true;
end;
end;
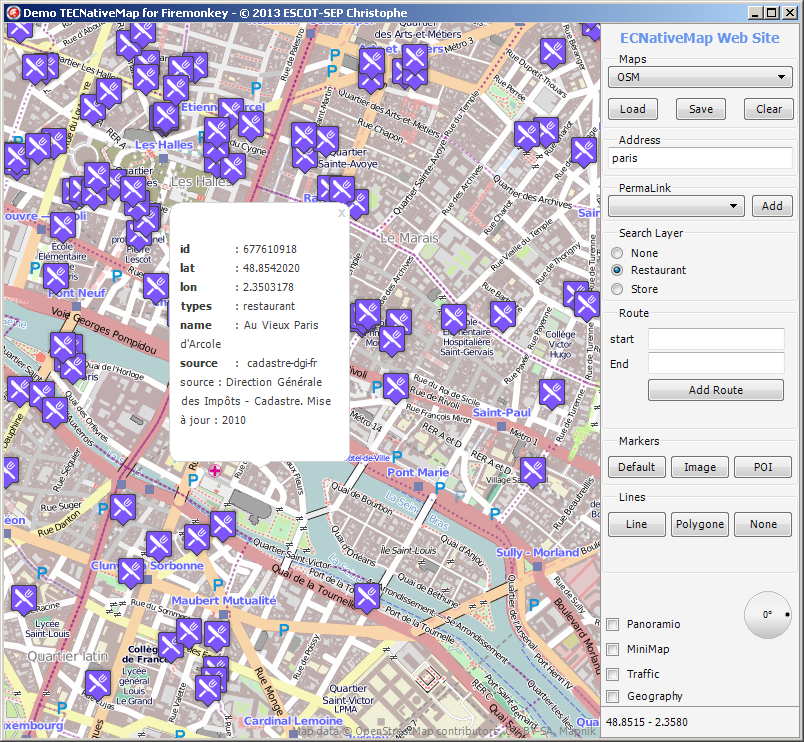
Par défaut les éléments du layer sont des TECShapeMarker mais vous pouvez changer le type de TECShape en redéfinissant TECNativePlaceLayer.doCreateShape(SearchResult : TECPlaceResult):TECShape;
XapiLayer
Préférez plutôt le layer OverPassApi
1XapiLayer utilise TECNativePlaceLayer et est directement intégrer dans TECNativeMap pour une utilisation simplifié.
La recherche s'effectue dans la zone affichée par votre carte et est mise à jour à chaque déplacement
property Shapes:TECShapes
property Search : string
La recherche s'effectue en faisant une requête sur un serveur XAPI
Vous pouvez rechercher tous les tags OSM en utilisant une syntaxe du type 'node[key=value]'
map.XapiLayer.Search := 'node[highway=bus_stop]';
Pour les nodes vous pouvez utiliser une syntaxe simplifiée.
map.XapiLayer.Search := 'highway=bus_stop';
Pour les clef amenity vous pouvez simplifier encore plus.
map.XapiLayer.Search := 'restaurant|bar|cafe';
Si vous ne spécifiez pas node dans votre requête les surfaces vont aussi être affichées.
2Pour les cacher définissez le style
Un point est rajouté au centre des surfaces, pour ne pas l'afficher, rajoutez le style
property Visible : boolean
property MaxItem : integer
property OnClick : TOnShape
property OnChange : TNotifyEvent
map.XapiLayer.OnChange := doOnXapiChange;
...
procedure TForm1.doOnXapiChange(sender : TObject);
begin
//
end;
// event click on xapi shape
procedure TForm1.doOnXapiClick(sender : TECshape);
begin
//
end;
Utilisez les styles pour habiller vos éléments
map.styles.addRule(Selector+':restaurant' +
'{graphic:base64,iVBORw0KGgoAAAANSUhEUgAAABIAAAAaBAMAAABI' +
'sxEJAAAAGXRFWHRTb2Z0d2FyZQBBZG9iZSBJbWFnZVJlYWR5ccllPAAAABJQTFRFAAAA////AAAAAAA'
+ 'AAAAAAAAA/h6U3wAAAAV0Uk5TAAAQgL++EJOXAAAAOElEQVQY02MIFQ0MFWRUCXVigLBcQ0OgrNDQUH'
+ 'JYQIDOMg0NDYawBIFC2FgCSCxBerFMg0Es02AAP34wMx8/aIAAAAAASUVORK5CYII=;visible:true;');
map.styles.addRule(Selector+':bar' +
'{graphic:base64,iVBORw0KGgoAAAANSUhEUgAAABoAAAAaCAYAAACpSkzOAAAAzklEQVRIx+2WUQ3'
+ 'FIAxFK2ES8HANVMIkIGUOkICESUDCJCABCdtPSQgJC2UjeXlZk3402e1ZoRSIGgZgA3AqfSOtAYgDoK'
+ 'iFmCxWaDLMaEAsoqDQBNGsGlDeHyexnbJPAHwpKuIe9zSwDFzFPR6egM4P9HMgX3YQgDSr67gQrsq51'
+ 'z8ZqqqSwHrOkhsZqguAo0iyS5weL1kD5qZUcjPNfXV1HPIThmaY9vr4QH8KknbPXbfMgtiqvSMA+1Zy'
+ 'lrNy9/SK8g0PVamc2NlTK98F1MyKB+QkmGEAAAAASUVORK5CYII=;visible:true;}');
map.styles.addRule(Selector+':cafe' +
'{graphic:base64,iVBORw0KGgoAAAANSUhEUgAAABoAAAAaCAYAAACpSkzOA'
+ 'AAAuUlEQVRIx2NgIACMjY0F0PgN+OTJBkCD9iMbCsT/cclTYkkCzGCoJfuB+D02eUosKQAZAjIM5nKQ'
+ 'JUBsgE2eEotQDIHyHXDJU2JRPyn8wQmgcfCfTPye1HghGw8/i4D4PBrbgVYWYcMGtLAoAakUmQ8VW0/'
+ 'TOALyFXDGHZUtEqCXRbCy8DzNLAKlNqTMn0ATi0AVI5LYflol7/1I7Pk4a18q5Zv3BKsPKpUMCvQogh'
+ 'RGS2+aW0SzGhYAB5lDXBZ7NtoAAAAASUVORK5CYII=;visible:true;}');
map.styles.addRule('#'+map.XapiLayer.Shapes.Name+ '.marker.highway:bus_stop {color:blue;styleicon:Flat;visible:true;}');
map.styles.addRule('#'+map.XapiLayer.Shapes.Name+ '.marker {scale:1;}');
map.styles.addRule('#'+map.XapiLayer.Shapes.Name+ '.marker:hover {scale:1.5;}');
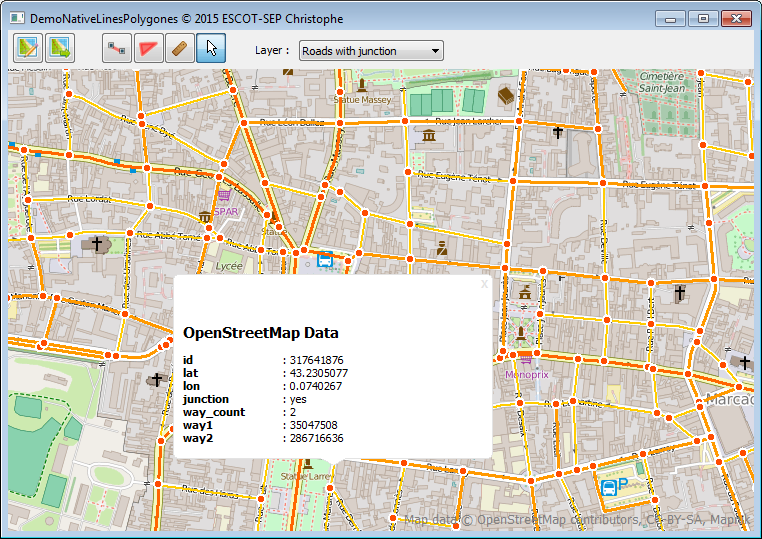
Way
Avec une syntaxe du type way[key=value] pour pouvez extraire des chemins.
map.styles.addRule(Selector+':restaurant' +
'{graphic:base64,iVBORw0KGgoAAAANSUhEUgAAABIAAAAaBAMAAABI' +
'sxEJAAAAGXRFWHRTb2Z0d2FyZQBBZG9iZSBJbWFnZVJlYWR5ccllPAAAABJQTFRFAAAA////AAAAAAA'
+ 'AAAAAAAAA/h6U3wAAAAV0Uk5TAAAQgL++EJOXAAAAOElEQVQY02MIFQ0MFWRUCXVigLBcQ0OgrNDQUH'
+ 'JYQIDOMg0NDYawBIFC2FgCSCxBerFMg0Es02AAP34wMx8/aIAAAAAASUVORK5CYII=;visible:true;');
map.styles.addRule(Selector+':bar' +
'{graphic:base64,iVBORw0KGgoAAAANSUhEUgAAABoAAAAaCAYAAACpSkzOAAAAzklEQVRIx+2WUQ3'
+ 'FIAxFK2ES8HANVMIkIGUOkICESUDCJCABCdtPSQgJC2UjeXlZk3402e1ZoRSIGgZgA3AqfSOtAYgDoK'
+ 'iFmCxWaDLMaEAsoqDQBNGsGlDeHyexnbJPAHwpKuIe9zSwDFzFPR6egM4P9HMgX3YQgDSr67gQrsq51'
+ 'z8ZqqqSwHrOkhsZqguAo0iyS5weL1kD5qZUcjPNfXV1HPIThmaY9vr4QH8KknbPXbfMgtiqvSMA+1Zy'
+ 'lrNy9/SK8g0PVamc2NlTK98F1MyKB+QkmGEAAAAASUVORK5CYII=;visible:true;}');
map.styles.addRule(Selector+':cafe' +
'{graphic:base64,iVBORw0KGgoAAAANSUhEUgAAABoAAAAaCAYAAACpSkzOA'
+ 'AAAuUlEQVRIx2NgIACMjY0F0PgN+OTJBkCD9iMbCsT/cclTYkkCzGCoJfuB+D02eUosKQAZAjIM5nKQ'
+ 'JUBsgE2eEotQDIHyHXDJU2JRPyn8wQmgcfCfTPye1HghGw8/i4D4PBrbgVYWYcMGtLAoAakUmQ8VW0/'
+ 'TOALyFXDGHZUtEqCXRbCy8DzNLAKlNqTMn0ATi0AVI5LYflol7/1I7Pk4a18q5Zv3BKsPKpUMCvQogh'
+ 'RGS2+aW0SzGhYAB5lDXBZ7NtoAAAAASUVORK5CYII=;visible:true;}');
map.styles.addRule('#'+map.XapiLayer.Shapes.Name+ '.marker.highway:bus_stop {color:blue;styleicon:Flat;visible:true;}');
map.styles.addRule('#'+map.XapiLayer.Shapes.Name+ '.marker {scale:1;}');
map.styles.addRule('#'+map.XapiLayer.Shapes.Name+ '.marker:hover {scale:1.5;}');
Vous pouvez aussi trouver les jonctions entres les routes.
Recherche manuelle
Lorsque le layer est visible la recherche est synchronisée avec la zone visible de votre carte.
Pour pouvoir effectuer une recherche sur n'importe quelle zone vous devez cacher le layer et utiliser Bound pour délimiter la zone de recherche.
Mapillary
Uniquement disponible pour Delphi 10.x et supérieur !
1Mapillary est un service du même type que Google Street Map, il permet d'afficher des photos au niveau des rues, l'avantage est que vous pouvez vous-même l'enrichir en enregistrant vos parcours.
TECNativeMap se contente d'utiliser les informations en libre accès au près de Mapillary, vous devez obtenir une clef pour utiliser les service de Mapillary.
Pour cela allez sur le site www.mapillary.com, connectez-vous, ajoutez vos applications, vous obtiendrez alors un token qui vous servira de clef.
Pour utiliser mapillary vous devez incorporer l'unité uecMappilary ou FMX.uecMappilary selon que vous utilisiez la version VCL ou FireMonkey
2Utilisez TECMapillaryLayer pour incorporer un layer Mapillary.
FMapillaryLayer.OnClick := doOnMapillaryLayerClick;
FMapillaryLayer.OnTrafficSignClick := doOnMapillaryLayerTrafficSignClick;
FMapillaryLayer.OnBeginRequest := doBeginRequest;
FMapillaryLayer.OnendRequest := doEndRequest;
FMapillaryLayer.LocalCache := ExtractfilePath(ParamStr(0)) + 'cache';
FMapillaryLayer.Visible := true;
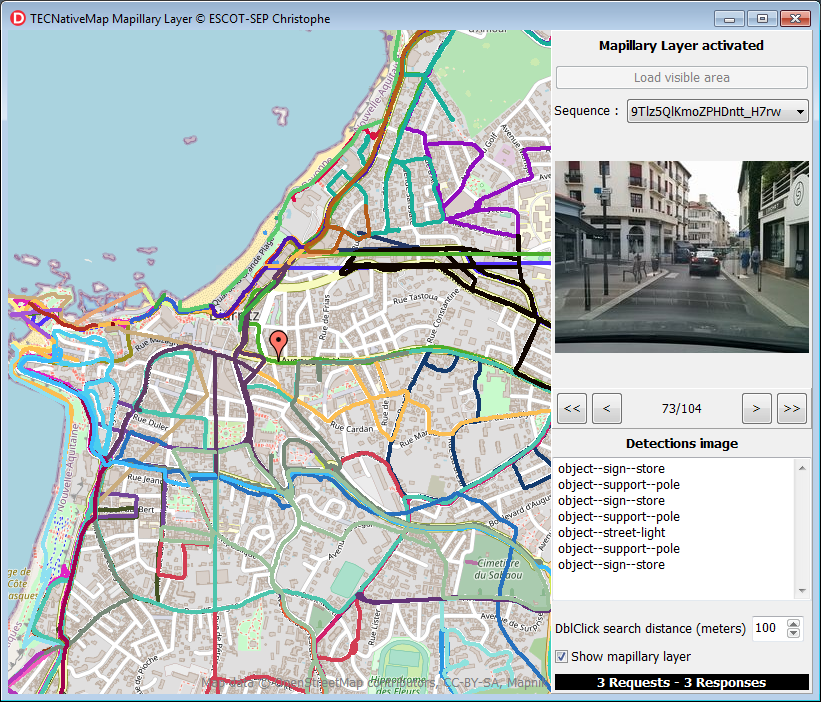
TECMapillaryLayer
function FindImageClose(const Lat, Lng: double; Distance: integer; var seq : TMapillarySequence; var PhotoIndex : integer ) : integer;
Trouver la photo la plus proche parmis celles affichées dans le layer, la recherche est en local.
Lat,Lng indique le point de départ de la recherche
Distance indique la distance maximale en mètres de la zone de recherche
Seq contiendra la séquence trouvée ou nil
PhotoIndex contiendra l'index de la photo dans seq ou -1
Retourne la distance en mètres entre le point de recherche et la photo, 0 si pas de photo
function SearchImageClose(const Lat,Lng:double; DistanceMeter : integer; ListSequenceImage : TListSequenceImage):integer;
Recherche l'ensemble des images comprise dans un rayon de DistanceMeter metres, la recherche est en local
Lat,Lng indique le point de départ de la recherche
DistanceMeter indique la distance maximale en mètres du rayon de recherche
ListSequenceImage contiendra une liste de TSequenceImage (un couple sequence, image index)
Retourne le nombre d'images trouvées
Voyez la démo MappilarySearchImages pour un exemple d'utilisation
3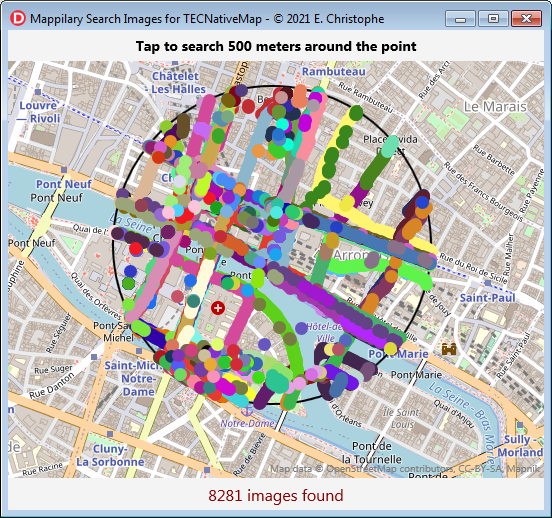
procedure SearchBounds(NorthEastLatitude, NorthEastLongitude, SouthWestLatitude, SouthWestLongitude: double);
function DetectionsImage(const image_id:int64;const List:TListDataDetections):integer;
id,
value,
create_at,
geometry : string;
end;
Remplir la liste avec l'ensemble des éléments détectés dans l'image, retourne le nombre d'éléments
L := TListDataDetections.Create;
try
n := FMapillaryLayer.DetectionsImage(SelectedSequence[SelectedImageIndex].Id,L);
Detections.Lines.BeginUpdate;
for i := 0 to n-1 do
Detections.Lines.Add(L[i].value);
Detections.Lines.EndUpdate;
finally
L.Free;
end;
property AccessToken: string ;
property Tiles: TMapillaryTiles
une TMapillaryTile contient une property Sequences:TMapillarySequences qui est une liste de TMapillarySequence qui elle même est une liste de TMapillaryImage
property Compass_angle: int64 ;
property Lat: double ;
property Lng: double ;
property Sequence_id: string ;
property Organization_id: int64 ;
property Id: int64 ;
property Captured_at: TDateTime ;
property is_Pano: boolean ;
property Url256: string;
property Url1024: string;
property Url2048: string;
end;
il y a aussi un property TrafficSign:TListTrafficSign qui est une liste de TTrafficSign
id : int64;
First_seen_at,
last_seen_at : TDateTime;
lat,lng : double;
value: string;
end;
procedure Clear;
Les données contenues dans les Tiles ne sont pas effacées, il n'y aura donc pas besoin d'une reconnexion aux serveurs mapillary pour les réafficher
4procedure ClearAll;
property Visible : boolean
property TrafficSignVisible : boolean
Affiche ou cache la signalisation
Déclenché lors d'un click sur une image mapillary
procedure TForm.doOnMapillaryLayerClick(Layer : TECMapillaryLayer; item : TECShape;
MapillarySequence : TMapillarySequence; ImageIndex : integer);
var bmp:TBitmap;
begin
// show photo in a TImage
bmp := TBitmap.Create;
try
// load image 256*256
// also url1024 and url2048
if FMapillaryLayer.LoadMapillaryBitmap(MapillarySequence[ImageIndex].Url256,bmp) then
Image.Picture.Assign(bmp);
finally
bmp.Free;
end;
end;
Déclenché lors d'un click sur un élément de traffic mapillary
procedure TForm30.doOnMapillaryLayerTrafficSignClick(layer: TECMapillaryLayer; item: TECShape;
ListTrafficSign: TListTrafficSign; TrafficSignIndex: integer) ;
begin
FMapillaryLayer.OpenWindow(item.Latitude,item.Longitude,
'<h4>'+ListTrafficSign[TrafficSignIndex].value+ '</h4><br>'+
'<tab="10"><b>Id</b><tab="40"> : '+IntToStr(ListTrafficSign[TrafficSignIndex].id)+ '<br>'+
'<tab="10"><b>Lat</b><tab="40"> : '+DoubleToStrDigit(ListTrafficSign[TrafficSignIndex].lat, 5)+'<br>'+
'<tab="10"><b>Lng</b><tab="40"> : '+DoubleToStrDigit(ListTrafficSign[TrafficSignIndex].lng, 5),
250 // width=250
);
end;
property OnSequenceColor:TOnMapillaySequenceColor;
Permet d'attribuer une couleur à une séquence.
Par défaut une couleur unique est attribuée en fonction de la clef de la séquence, une séquence aura donc toujours la même couleur.
6property OnBeginRequest: TNotifyEvent
property OnEndRequest: TNotifyEvent
procedure TForm.doEndRequest(sender: TObject);
var i,j:integer;
begin
ComboSequences.Items.BeginUpdate;
ComboSequences.items.clear;
for i := 0 to FMapillaryLayer.Tiles.Count-1 do
for j :=0 to FMapillaryLayer.Tiles[i].Sequences.Count-1 do
// store name and TMapillarySequence
ComboSequences.items.addObject(FMapillaryLayer.Tiles[i].Sequences[j].Sequence_id,FMapillaryLayer.Tiles[i].Sequences[j]);
ComboSequences.Items.EndUpdate;
end;
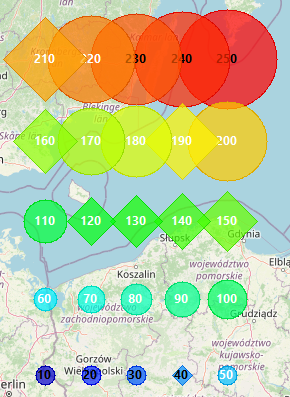
Heatmap
Une carte thermique permet de représenter l'intensité des données pour des points géographiques.
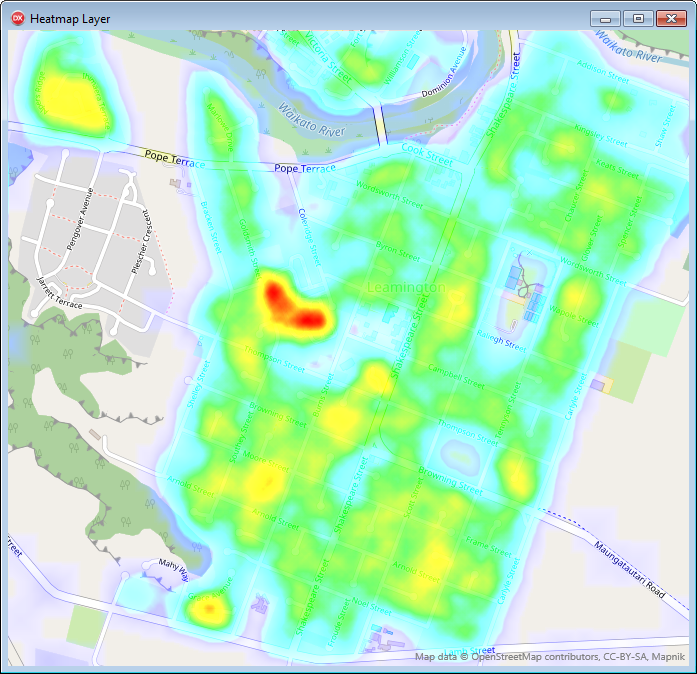
TECHeatmapLayer est la classe qui permet de gérer ce type de layer.
constructor Create(_FMap: TECNativeMap);HeatmapLayer := TECHeatmapLayer.Create(map);
procedure Clear;
Effacer l'ensemble des données
procedure Add(const Latitude, Longitude: double; const value: double = 1);
Ajouter un point géographique et lui assigner une valeur, vous pouvez faire plusieurs ajouts sur un même point.
procedure Remove(const latitude, longitude: double; const Value: double);
Après l'ajout des points, appelez Update pour actualiser le layer
property AutomaticUpdate: boolean
property Palette: THeatPalette
Palette permet de gérer les couleurs qui sont utilisées pour créer le dégradé
// addColor(Red,Green,Blue,Value)
// Red,Green, and Blue byte 0..255
// value double 0..1
// this is the default palette, you can also use Palette.reset for recreate it
HeatmapLayer.Palette.AddColor(0,0,0,0); // black for value=0
HeatmapLayer.Palette.AddColor(0,0,255,0.1);// blue for value=0.1
HeatmapLayer.Palette.AddColor(0,255,255,0.25); // cyan for value=0.25
HeatmapLayer.Palette.AddColor(0,255,0,0.5); // green for value=0.5
HeatmapLayer.Palette.AddColor(255,255,0,0.75); // yellow for value=0.75
HeatmapLayer.Palette.AddColor(255,0,0,1); // red for value=1
property Visible: boolean ;
property PointIsDisc : boolean;
Détermine si le point est affiché sous la forme d'un disque, sinon c'est un carré
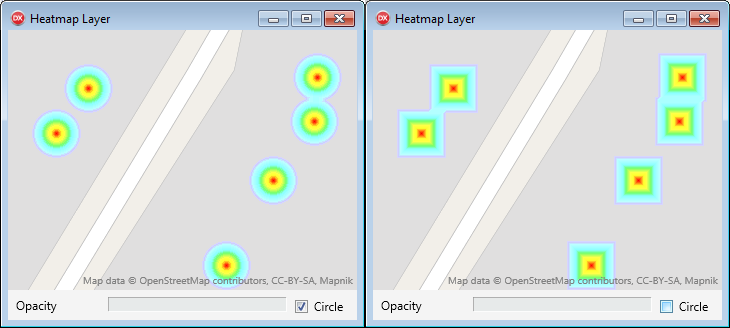
Property Radius:integer;
Taille du point
property Opacity : byte;
Change l'opacité du layer (de 0 à 100)
property MinZoom: byte ;
Zoom minimal pour que le layer s'affiche
property MaxZoom: byte ;
Zoom maximal pour que le layer s'affiche
property GroupZIndex: integer ;
Zindex du groupe contenant l'ensemble des heatmaps, l'affichage s'effectue dans l'ordre croissant des ZIndex
property ZIndex: integer ;
ZIndex du layer par rapport aux autres heatmap
property OnUpdate: TNotifyEvent;
Événement déclenché lorsque la carte thermique a été généré
Weather Layer
En utilisant les services d'OpenWeathermap.org vous pourrez superposer des layers owPrecipitation, owSnow, owClouds, owPressure, owTemp, owWind// see pressure
map.OpenWeatherTilesLayer.Add(owPressure) ;
// see precipitation
map.OpenWeatherTilesLayer.Add(owPrecipitation) ;
// remove pressure
map.OpenWeatherTilesLayer.remove(owPressure) ;
TomTom Traffic Incidents
Contrairement aux tuiles incidents de tomtom, ce layer permet d'obtenir des informations sur les incidents lors du survol de la souris ou par une pression du doigt.
map.TomTom.Key := 'your api key';
map.TomTom.Incident.Layer := true;
TECTomTomIncident
property CategoryLabel : TStringList
Vous pouvez l'utiliser pour effectuer une traduction mais veillez bien à respecter l'ordre et le nombre d'éléments.
property CacheTime : int64
property Layer : boolean
property InfoStyle : TInfoWindowStyle
property FontColor : TColor
property BorderColor : TColor
property Break : integer
property Tab : integer
property TextDelay : string
property TextLength : string
property TextFrom : string
property TextTo : string
property Width : integer
property YAnchor : integer
property OnClick : TOnShapeMouseEvent
// show all properties
procedure TForm1.doIncidentClick(sender: TObject; const item: TECShape);
var Key, Value, content: string;
win: TECShapeInfoWindow;
begin
content := '';
if item.PropertiesFindFirst(Key, Value) then
begin
repeat
// if necessary line break
if content<>'' then content := content+'<br>';
// align the values to 110 pixels
Key := Key + '<tab=110>';
// Bold the keys
content := content + '<b>' + Key + '</b>: ' + Value ;
// continue as long as there are properties
until item.PropertiesFindNext(Key, Value);
end;
// create window if not exists
if map['info'].InfoWindows.count = 0 then
begin
win := map['info'].AddInfoWindow;
win.Width := 350;
end
else
win := map['info'].InfoWindows[0];
win.content := content;
win.SetPosition(map.MouseLatLng.Lat, map.MouseLatLng.lng);
win.Visible := true;
end;
Styler les informations
property Style : string
Contient les styles attribués aux lignes.
Par défaut comme pour les tuiles de TomTom les couleurs sont fonctions de l'amplitude du délai
'#TOMTOM-INCIDENT.line.magnitudeOfDelay:0 {color:#BFBFBF}';
'#TOMTOM-INCIDENT.line.magnitudeOfDelay:1 {color:#F58240}';
'#TOMTOM-INCIDENT.line.magnitudeOfDelay:2 {color:#EB4C13}';
'#TOMTOM-INCIDENT.line.magnitudeOfDelay:3 {color:#AB0000}';
'#TOMTOM-INCIDENT.line.magnitudeOfDelay:4 {color:#8B837D}';
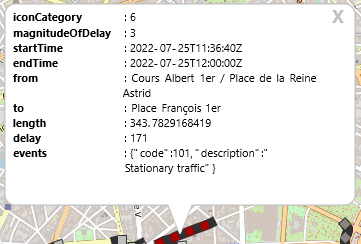
L'infoWindow est dotée de propriétés qui vont vous permettre de définir un style en réaction
- iconCategory : 0-14 index sur la liste CategoryLabel
- delay : nombre de secondes
- length : nombre de mètres
map.Styles.addRule('#TOMTOM-INCIDENT.infowindow{bcolor:light(gray,128);color:white;fontcolor:black}');
// style if the wait is more than 5mn (delay>300)
map.Styles.addRule('#TOMTOM-INCIDENT.infowindow{if:delay>300;bcolor:dark(red,128);color:light(red,96);fontcolor:white}');
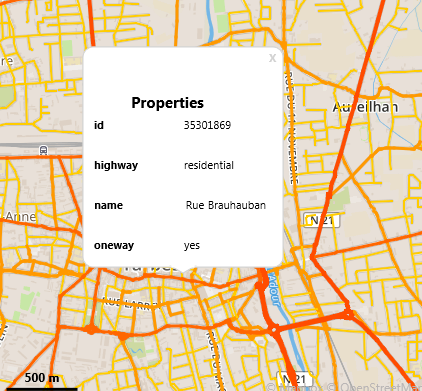
Layer OverPassApi
Ce layer a la même utilité que le layer XAPI mais il utilise OverPassApi qui est une technologie plus récente et doit donc être vu comme le remplaçant du layer XAPI.
Le but est d'extraire des données spécifique d'OpenStreetMap se trouvant dans la zone affichée de votre carte, une réactualisation automatique a lieu après chaque déplacement.
Si vous définissez un cache local les recherches y seront enregistrées et seront disponibles en mode hors-ligne.
7
procedure Amenity(value: string;const Data:TSetOSMData=[odNode,odWay]);
Data indique si l'on cherche les node et/ou les Way
procedure Amenity(values: array of string;const Data:TSetOSMData=[odNode,odWay]; const Op: TBinaryFilterOSM = bfOr);
les procedures Amenity() sont une simplification des procedures Tag(), avec un tag_key implicitement égal à "amenity"
8procedure Tag(const key, value: string;const Data:TSetOSMData=[odNode,odWay]);
Data indique si l'on cherche les Nodes et/ou les Ways.
procedure Tag(const key:string;const values: array of string;const Data:TSetOSMData=[odNode,odWay]; const Op: TBinaryFilterOSM = bfAnd);
op=bfAnd ne retourne les tags que s'ils ont toutes les values
op=bfOr sélection le tag s'il a au moins une Value
procedure Tag(const tags: array of string;const Data:TSetOSMData=[odNode,odWay]; const Op: TBinaryFilterOSM = bfAnd);
property Query: string
map.OverPassApi.layer.Tag('highway','residential',[odWay]);
// search Way 'highway'='residential' OR 'highway'='primary'
map.OverPassApi.layer.Tag('highway',['residential','primary'],[odWay],bfOr);
//search Way width highway=residential AND name='Park Avenue'
map.OverPassApi.layer.Tag(['highway','residential','name','Park Avenue'],[odWay],bfAnd);
// search Nodes and Way amenity=parking
map.OverPassApi.layer.Amenity('parking']);
// search only Nodes amenity=restautant or amenity=parking
map.OverPassApi.layer.Amenity(['restaurant','parking'],[odNode]);
// search nodes and ways amenity=parking
map.OverPassApi.layer.Query := 'nw[amenity=parking]';
property Group: TECShapes
property Visible: boolean
property TimeOut: integer
property OnBeginQuery: TNotifyEvent
property OnEndQuery: TNotifyEvent
property OnClick: TOnShapeMouseEvent
property OnData:TECOnOverPassLayerData
map.OverPassApi.Layer.OnEndQuery := doOnEndQuery;
map.OverPassApi.Layer.OnClick := doOnClick;
map.OverPassApi.Layer.OnData := doOnData;
...
// fired when xml data ready
procedure TForm9.doOnData(const XmlValue:string);
begin
XmlData.Lines.Text := XmlValue;
end;
// fired when click on ovepassapi layer item
procedure TForm9.doOnClick(sender: TObject; const item: TECShape);
var Key, Value, content: string;
win: TECShapeInfoWindow;
begin
content := '';
if item.PropertiesFindFirst(Key, Value) then
begin
repeat
// if necessary line break
if content<>'' then content := content+'<br>';
// align the values to 100 pixels
Key := Key + '<tab=100>';
// Bold the keys
content := content + '<b>' + Key + '</b>: ' + Value ;
// continue as long as there are properties
until item.PropertiesFindNext(Key, Value);
end;
// create window if not exists
if map.OverPassApi.Layer.Group.InfoWindows.count = 0 then
begin
win := map.OverPassApi.Layer.Group.AddInfoWindow;
win.Width := 270;
end
else
win := map.OverPassApi.Layer.Group.InfoWindows[0];
win.content := content;
win.SetPosition(map.MouseLatLng.Lat, map.MouseLatLng.lng);
win.Visible := true;
end;
// start query
procedure TForm9.doOnBeginQuery(sender : TObject);
begin
QuerySearch.Visible := true;
end;
// end query
procedure TForm9.doOnEndQuery(sender : TObject);
begin
QuerySearch.Visible := false;
end;
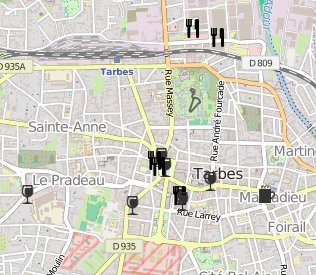
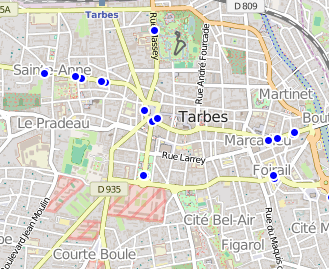
Bubble Layer
Un calque à bulles affiche des symboles (cercles ou autres formes) et éventuellement des labels. La taille et la couleur peuvent être contrôlées par des mesures, les labels par des propriétés. La position peut être spécifiée sous forme de lieu ou de valeurs de latitude et de longitude.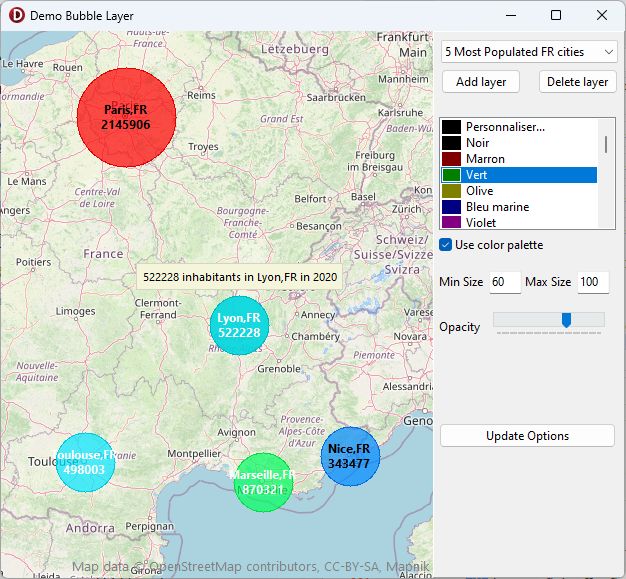
TECBubbleLayers
Gestionnaire de layers
function Add(const Name: string): TECBubbleLayer;procedure Delete(const index: integer);
property MinItemSize: integer
property List[const index: integer]: TECBubbleLayer
poiHexagon, poiDiamond, poiText, poiArrow, poiArrowHead, poiCross,
poiDiagCross, poiDirectionSign)
Vous retrouvez la plus part de ses propriétés au niveau du layer, cela vous permet de les centraliser.
9Map.BubbleLayers.OnEditBubble := doOnEditBubble;
Map.BubbleLayers.OnClick := doOnClick;
Map.BubbleLayers.OnRightClick := doOnRightClick;
Map.BubbleLayers.OnChange := doOnChangeLayers;
// click on bubble
procedure TForm.doOnClick(sender: TObject; const item: TECShape);
begin
caption := TECBubbleLayer(sender).Name + ' : ' + item.PropertyFormat(item.Hint);
end;
// right click on bubble
procedure TForm.doOnRightClick(sender: TObject; const item: TECShape);
begin
caption := TECBubbleLayer(sender).Name + ' : ' + item.PropertyFormat(item.Hint)+' (Right)';
end;
// event triggered after the automatic creation
// you can modify your element as you wish, to change its shape and color for example
procedure TForm.doOnEditBubble(const BubbleShape:TECShapePoi);
begin
if BubbleShape['shape']= '1' then
begin
BubbleShape.POIShape := poiDiamond;
BubbleShape.Color := getInvertColor(BubbleShape.color);
end;
end;
// event triggered after add or delete TECBubbleLayer
procedure TForm.doOnChangeLayers(sender : TObject);
begin
Map.BubbleLayers.getLayers(Layers.Items) ;
delete.Enabled := layers.ItemIndex>-1;
end;
TECBubbleLayer
procedure Clear;function Add(const Lat, Lng, Size: double;const properties:string=''): TECBubbleItem;
function Add(const location: string; Size: double;const properties:string=''): TECBubbleItem;
property Color: TColor
property UseColorPalette: boolean
property ColorPalette: THeatPalette
Palette qui calcule une couleur en fonction de l'échelle de l'élément
// Red,Green, and Blue byte 0..255
// value double 0..1,
// value corresponds to a percentage
// 0.5 is equivalent to an element that is half the size of the largest
// this is the default palette, you can also use Palette.reset for recreate it
Layer.ColorPalette.AddColor(0,0,0,0); // black for value=0
Layer.ColorPalette.AddColor(0,0,255,0.1);// blue for value=0.1
Layer.ColorPalette.AddColor(0,255,255,0.25); // cyan for value=0.25
Layer.ColorPalette.AddColor(0,255,0,0.5); // green for value=0.5
Layer.ColorPalette.AddColor(255,255,0,0.75); // yellow for value=0.75
Layer.ColorPalette.AddColor(255,0,0,1); // red for value=1
property HintProperty: string
property MaxItemSize: integer
property MinItemSize: integer
property Labels: TLabelShape
property Opacity: byte
property shape: TPOIShape
property MaxZoom: byte
property MinZoom: byte
property Name: string
property List[const index: integer]: TECBubbleItem
property ZIndex: integer
// in the cumulated it takes time
// the best is to use directly the GPS coordinates
// here it is used for documentation purposes
procedure TForm10.Add_5_Most_Populated_FR_cities;
var FBubbleLayer : TECBubbleLayer;
begin
FBubbleLayer := Map.BubbleLayers.Add('5 Most Populated FR cities');
// Global Hint where the properties of each element will be injected
FBubbleLayer.Hint := '[size] inhabitants in [location] in 2020';
// the color will be determined according to the size using the layer's color palette
FBubbleLayer.UseColorPalette := true;
// the size of the elements will be scaled between 60 and 100 pixels depending on size
FBubbleLayer.MinItemSize := 60;
FBubbleLayer.MaxItemSize := 100;
// labels will be displayed for zoom 5 and more
FBubbleLayer.Labels.MinZoom := 5;
// the label will be composed of the properties 'location' and 'size'
FBubbleLayer.Labels.LabelMask := '[location]'+#13#10+'[size]';
FBubbleLayer.Labels.LabelType := ltMask;
// the position is determined by their location
// its size by the number of inhabitants
FBubbleLayer.Add('Paris,FR',2145906);
FBubbleLayer.Add('Marseille,FR',870321);
FBubbleLayer.Add('Lyon,FR',522228);
FBubbleLayer.Add('Toulouse,FR',498003);
FBubbleLayer.Add('Nice,FR',343477);
// Add('location',size) automatically sets the 'location' and 'size' properties
// you can add properties with these two syntaxes
// var bubble:TECBubbleItem;
// bubble := FBubbleLayer.Add('Paris,FR',2145906,'prop1=data1,prop2=data2');
// bubble['propx'] := 'datax';
// update of the layer display
FBubbleLayer.Update;
// zoom in to show all elements
FBubbleLayer.fitBounds;
end;
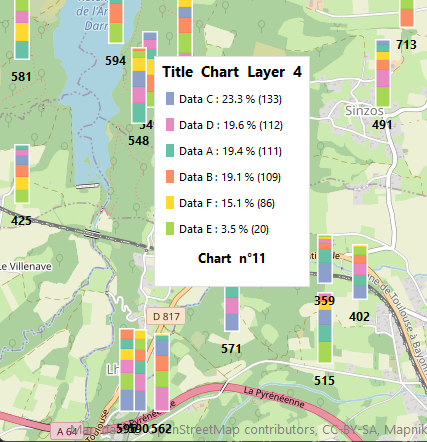
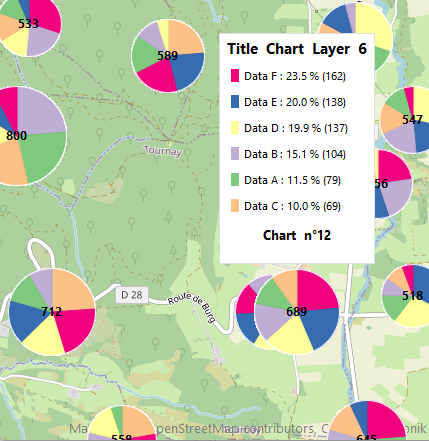
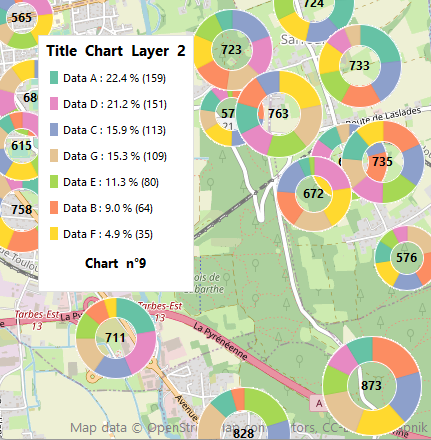
Chart Layer
Ce calque permet d'afficher des diagrammes circulaires ou des barres empilées.
TECChartLayers
Gestionnaire de layers TECChartLayer
function Add(const Name: string): TECChartLayer;procedure Delete(const index: integer);
property MinItemSize: integer
property List[const index: integer]: TECChartLayer
Vous retrouvez la plus part de ses propriétés au niveau du layer, cela vous permet de les centraliser.
10procedure TFormChartLayer.doOnClick(Sender: TObject; const item: TECShape);
begin
caption := 'Click Left - '+TECchartLayer(Sender).Name +
' : Chart n°'+inttostr(item.IndexOf)+' Total =' + item['total'] ;
// if needed you can access TECChartItem with TECChartItem(item.item)
end;
// right click on chart
procedure TFormChartLayer.doOnRightClick(Sender: TObject; const item: TECShape);
begin
caption := 'Click Right - '+TECchartLayer(Sender).Name +
' : Chart n°'+inttostr(item.IndexOf)+' Total =' + item['total'] ;
end;
procedure TFormChartLayer.FormCreate(Sender: TObject);
begin
map.ChartLayers.OnChange := doOnChangeLayers;
map.ChartLayers.OnClick := doOnClick;
map.ChartLayers.OnRightClick := doOnRightClick;
// The size of the diagrams will also be adapted according to the zoom
map.ScaleMarkerToZoom := true;
tag := 0;
TotalLayer := 0;
end;
TECCharLayer
procedure Clear;property BarThickness : integer
property Color: TColor
property BorderColor: TColor
property Count: integerproperty HintColor: TColor
property Labels: TLabelShapeproperty MaxChartSize: integer
property MinChartSize: integer ;
property Opacity: byte
property ChartType: TECChartType
property MaxZoom: byte
property MinZoom: byte
property Visible : boolean
property Name: string
property List[const index: integer]: TECChartItem ;
property ZIndex: integer
property OnClick: TOnShapeMouseEvent
property OnRightClick: TOnShapeMouseEvent
property OnValidHint : TOnValidHint
// palettes from https://colorbrewer2.org
palettes : array [0..2]of array [0..7] of string = (
('#7fc97f','#beaed4','#fdc086','#ffff99','#386cb0','#f0027f','#bf5b17','#666666'),
('#d53e4f','#f46d43','#fdae61','#fee08b','#e6f598','#abdda4','#66c2a5','#3288bd'),
('#66c2a5','#fc8d62','#8da0cb','#e78ac3','#a6d854','#ffd92f','#e5c494','#b3b3b3')
);
// change default hint legend
procedure doOnValideHint(const Sender: TECChartItem; const index: integer;
const percent, value: double; var hint: string);
begin
// a positive index indicates a data line
if index >-1 then
hint := Sender.Layer.Fields[index].Legend + ' : ' + doubletostrdigit(percent,
1) + ' % (' + doubletostr(value) + ')'
else // -1 indicates that the legend is complete, you can enrich it
Hint := '<h3><center>'+sender.Layer.Caption+ '</center></h3>'+
hint+
'<h4><center>Chart n°'+inttostr(sender.Shape.IndexOf)+'</center></h4>';
end;
// create random layer
procedure TFormChartLayer.addLayerClick(Sender: TObject);
var
Lat, Lng: double;
x, y, i,id_pal, delta_lat, delta_lng: integer;
s: string;
FChartLayer: TECChartLayer;
FChartType: TECChartType;
chart: TECChartItem;
begin
// cycle chart type
case tag of
0:
begin
FChartType := ctPie;
s := 'Pie';
end;
1:
begin
FChartType := ctDonut;
s := 'Donut';
end;
2:
begin
FChartType := ctFillDonut;
s := 'FillDonut';
end;
3:
begin
FChartType := ctVerticalStackedBar;
s := 'VerticalStackedBar';
end;
else
begin
FChartType := ctHorizontalStackedBar;
s := 'HorizontalStackedBar';
end;
end;
tag := tag + 1;
if tag>4 then tag := 0;
// create layer
FChartLayer := map.ChartLayers.Add(s + ' ' + timeTosTr(time));
inc(TotalLayer);
FChartLayer.Caption := 'Title Chart Layer ' + inttostr(TotalLayer);
// adapt the graph legend
FChartLayer.OnValidHint := doOnValideHint;
// create random datas
// select palette
id_pal := random(3);
// between 4 and 8 lines of data
for i := 0 to 3 + random(5) do
FChartLayer.AddField('Data ' + chr(i + ord('A')), StrToColor(palettes[id_pal][i]));
FChartLayer.ChartType := FChartType;
// labels will be displayed for zoom 3 and more
FChartLayer.Labels.MinZoom := 3;
if FChartLayer.ChartType < ctVerticalStackedBar then
begin
// max radius 50
FChartLayer.MaxChartSize := 50;
FChartLayer.Labels.Align := laCenter;
end
else // stacked bar
begin
// max bar size 100
FChartLayer.MaxChartSize := 100;
FChartLayer.Labels.Align := laBottom;
end;
FChartLayer.MinChartSize := 16;
// distribute 4 * 4 graphs on the visible surface of the map
delta_lat := round(((map.NorthEastLatitude - map.SouthWestLatitude) * 1000));
delta_lng := round(((map.NorthEastLongitude - map.SouthWestlongitude) * 1000));
for y := 0 to 3 do
begin
for x := 0 to 3 do
begin
Lat := map.SouthWestLatitude + (random(delta_lat) / 1000);
Lng := map.SouthWestlongitude + (random(delta_lng) / 1000);
// create chart
chart := FChartLayer.Add(Lat, Lng);
// add ramdom value
// automatically sets the 'total' propertie
for i := low(FChartLayer.Fields) to High(FChartLayer.Fields) do
chart.data[i] := random(100) + random(99);
end;
end;
// generate the elements on the map
FChartLayer.Update;
// zoom it
FChartLayer.fitBounds;
layers.ItemIndex := layers.Items.Count - 1;
Delete.Enabled := true;
end;
AirQuality
Ce layer affiche le taux de pollutions de l'air dans le monde, il utilise les donnés du projet World Air Quality Index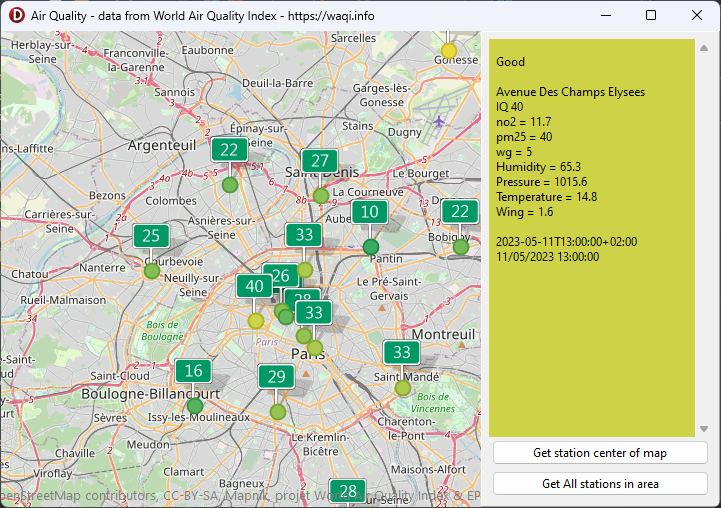
procedure getJSON(const Lat, Lng: double)
procedure getJSON(const city: string)
procedure getJSON(const Lat, Lng, lat2, lng2: double)
Les données sont retournées au format JSON,
l'évènement OnJson est déclenché dès qu'elles sont
disponibles.
L'évènement OnRequest est déclenché lorsque la requête
est lancée.
begin
// get your free key from https://aqicn.org/data-platform/token/
map.AirQuality.key := '';
map.AirQuality.OnJson := doOnJson;
map.AirQuality.OnClick := doOnclick;
map.AirQuality.OnRequest := doOnRequest;
map.AirQuality.visible := true;
end;
/// Request the list of stations located in the visible area of the map.
/// The list is returned in json format, the OnJson event is triggered as soon as it is available
procedure TFormAirQuality.getallstationsClick(Sender: TObject);
begin
map.AirQuality.getJSON(map.SouthWestLatitude,map.SouthWestLongitude,map.NorthEastLatitude,map.NorthEastLongitude);
end;
/// Request data from the station closest to the center of the map
/// Data is returned in json format, the OnJson event is triggered as soon as it is available
procedure TFormAirQuality.GetStationClick(Sender: TObject);
begin
map.AirQuality.getJSON(map.Center.Lat,map.Center.Lng);
end;
/// Triggered when the response of a call to getJSON is available
/// The response is contained in Json, Query contains the parameters of the request
procedure TFormAirQuality.doOnJson(sender: TObject; const Query, JSon: string) ;
begin
MJson.Lines.Text := Json;
end;
/// Triggered just before call getJSON or click on Station
procedure TFormAirQuality.doOnRequest(sender : TObject);
begin
MJson.Lines.Text := 'result pending...';
end;
function JsonToAirQualityCity(const json:string):TAirQualityCity
Query,
Json,
Name: string;
latitude: double;
longitude: double;
DominantPollutant: TAirQualityItem;
Pollutants: TAirQualityPollutants;
Weather: TAirQualityWeather;
IsoTime: string;
Time: TDateTime;
level: TAirQualityLevel;
LevelColor: TColor;
end;
property AirQualityIndex: TAirQualityIndex
Choix de l'index principal affiché sur les tuiles
![]()
Par défaut usepa_aqi qui indique le polluant principal
property Key: string
property Visible: boolean
property City: TAirQualityCity
Pour que la requête soit déclenchée il faut que OnClick ou OnHover soit renseigné.
12property OnJson: TAirQualityOnJson
property OnClick : TAirQualityEvent
property OnHover : TAirQualityEvent
property OnRequest : TNotifyEvent
procedure TFormAirQuality.doOnclick(const sender : TAirQualityCity);
var i:integer;
level:string;
begin
// all data in json format are available in sender.Json
MJSon.text := #13#10+ map.AirQuality.Legend[sender.Level]+#13#10#13#10;
MJSon.Lines.Add(Sender.Name);
MJson.Lines.Add('IQ '+DoubleToStr(Sender.DominantPollutant.Value));
for i := 0 to High(sender.Pollutants) do
MJson.Lines.Add(Sender.Pollutants[i].Name+' = '+DoubleToStr(sender.Pollutants[i].value));
for i := 0 to High(sender.weather) do
MJson.Lines.Add(sender.weather[i].Name+' = '+DoubleToStr(sender.weather[i].value));
MJSon.Lines.Add('');
MJSon.Lines.Add(sender.IsoTime);
MJSon.Lines.Add(DateTimeToStr(sender.Time));
MJSon.Color := sender.LevelColor;
MJSon.Font.Color := GetContrastingColor(sender.LevelColor);
end;
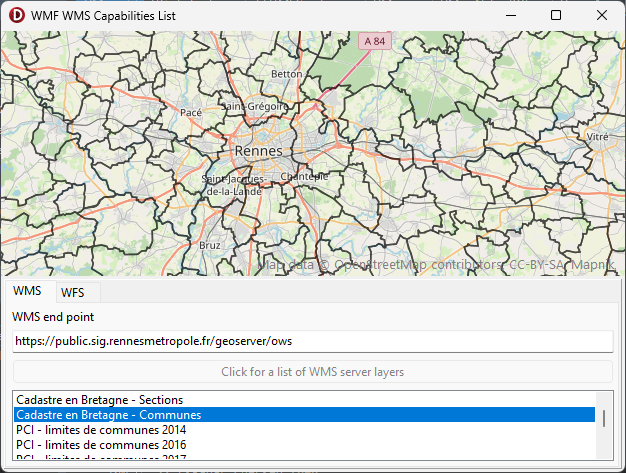
Layer WMS
La propropriété WMSLayers du composant TECNativeMap vous permet de gérer une lise de layer WMS
...
WMS_Cadastre := map.WMSLayers.Add('https://geobretagne.fr/geoserver/cadastre/wms', // url service
'CP.CadastralParcel', // layer
'CADASTRE' // TECNativeMap group name
);
TECWMSLayers
function Count: integer;procedure Refresh;
procedure Clear;
function Add(const Url, layers, Name: string): TECNativeWMS;
procedure Delete(const Name: string);
procedure Delete(const index: integer);
procedure Delete(const index: TECNativeWMS);
function IndexOf(const Name: string): integer;
property Layer[const index: integer]: TECNativeWMS; default
property Layer[const index: string]: TECNativeWMS; default
property OnCapabilities : TNotifyEvent
property OnFeatureInfo : TNotifyEvent
property OnEnabled : TNotifyEvent
property OnChangeTimeDimension
property OnLoadingTimeDimension
...
// event triggered when TimeDimension tiles is loading
procedure TFormWMS_WFS.doOnLoadingTimeDimension(Sender: TObject);
var
WMSLayer: TECNativeWMS;
begin
if Sender is TECNativeWMS then
begin
WMSLayer := Sender as TECNativeWMS;
if assigned(WMSLayer) then
begin
TimeLoading.Position := WMSLayer.LoadingPercentTimeDimension;
TimeLoading.Visible := WMSLayer.LoadingPercentTimeDimension< 100;
end;
end
end;
property OnEnabledTimeDimension
map.WMSLayers.OnCapabilities := doOnCapabilities;
map.WMSLayers.OnFeatureInfo := doOnFeatureInfo;
map.WMSLayers.OnEnabled := doOnEnabled;
map.WMSLayers.OnChangeTimeDimension := doOnChangeTimeDimension;
map.WMSLayers.OnEnabledTimeDimension := doOnEnabledTimeDimension;
...
// OnEnabled is triggered when the visible area of the map moves in or out of the layers.
// When Enabled is false, no more requests are made to the server.
procedure TFormWMS_WFS.doOnEnabled(Sender: TObject);
var
WMSLayer: TECNativeWMS;
begin
if Sender is TECNativeWMS then
begin
WMSLayer := Sender as TECNativeWMS;
if assigned(WMSLayer) then
begin
events.lines.Add(WMSLayer.Name + ' ENABLED : ' +
BoolToStr(WMSLayer.Enabled));
end;
end
end;
// event triggered each time the TimeDimension enabled/disable
procedure TFormWMS_WFS.doOnEnabledTimeDimension(Sender: TObject);
var
WMSLayer: TECNativeWMS;
begin
if Sender is TECNativeWMS then
begin
WMSLayer := Sender as TECNativeWMS;
if assigned(WMSLayer) then
begin
events.lines.Add(WMSLayer.Name + ' TIMEDIMENSION ENABLED : ' +
BoolToStr(WMSLayer.TimeDimension.Enabled));
end;
end
end;
// event triggered each time the TimeDimension period changes
procedure TFormWMS_WFS.doOnChangeTimeDimension(Sender: TObject);
var
WMSLayer: TECNativeWMS;
begin
if Sender is TECNativeWMS then
begin
WMSLayer := Sender as TECNativeWMS;
if assigned(WMSLayer) then
begin
Time.Caption := WMSLayer.Time;
end;
end
end;
// A GetCapabilities request is automatically made to the server,
// when the data is available OnCapabilities is triggered
// and the data is available in the Capabilities string.
// You can restart a request using the GetCapabilities procedure
procedure TFormWMS_WFS.doOnCapabilities(Sender: TObject);
var
WMSLayer: TECNativeWMS;
begin
if Sender is TECNativeWMS then
begin
WMSLayer := Sender as TECNativeWMS;
if assigned(WMSLayer) then
begin
// show Bounding Box
events.lines.Add(WMSLayer.Name + ' BBOX :' +
doubletoStrDigit(WMSLayer.SWLat, 6) + ' ' +
doubletoStrDigit(WMSLayer.SWLng, 6) + ' ' +
doubletoStrDigit(WMSLayer.NELat, 6) + ' ' +
doubletoStrDigit(WMSLayer.NELng, 6));
end;
end
end;
// A GetFeatureInfo request is automatically made to the server,
// when the data is available OnFeatureInfo is triggered
// and the data is available in the FeatureInfo string.
// You can restart a request using the GetFeatureInfo procedure
procedure TFormWMS_WFS.doOnFeatureInfo(Sender: TObject);
var
WMSLayer: TECNativeWMS;
begin
if Sender is TECNativeWMS then
begin
WMSLayer := Sender as TECNativeWMS;
if assigned(WMSLayer) then
begin
events.lines.Add('GET FEATUREINFO : ' + WMSLayer.Name);
end;
end
end;
TECNativeWMS
property Capabilities: string;Elles sont récupérés dans un Thread, l'événement TECWMSLayers.OnCapabilities est activé lorsqu'elles sont disponibles.
Elles sont récupérés dans un Thread, l'événement TECWMSLayers.OnFeatureInfo est activé lorsqu'elles sont disponibles
Permet de spécifier une date sous la forme du chaine au format ISO 8601.
Laissez vide pour obtenir les données les plus récentes
// set Minute and seconde to 0
datetime := SetHourMinuteSeconde(Now, -1, 0, 0);
// show last hour
WMS_Layer_Radar.TimeDimension.StartTime := decHour(datetime, 1);
WMS_Layer_Radar.TimeDimension.EndTime := datetime;
// period 5 minutes
WMS_Layer_Radar.TimeDimension.PeriodMillisecondes := 5 * 60 * 1000;
WMS_Layer_Radar.TimeDimension.TransitionMillisecondes := 500;
// You can also directly pass an array of TDateTime
// WMS_Layer_Radar.TimeDimension.AddTime([datetime1, datetime2,..,datetimex]);
// loop
WMS_Layer_Radar.TimeDimension.Loop := true;
// activate timedimension
WMS_Layer_Radar.EnabledTimeDimension := true;
procedure StartTimeDimension;
procedure EndTimeDimension;
procedure NextTimeDimension;
procedure PrevTimeDimension;
property PauseTimeDimension: boolean
property Url: string
property LegendHeight: integer
property LegendOpacity: byte
Tableau de TECRecordLayer qui contient les informations sur les layers disponibles sur le serveur, ce tableau est rempli après l'appel à getCapabilities, vous pourrez y avoir accès dès que OnCapabilities aura été déclenché.
getCapabilities est automatiquement appelé lors de la creation du layer.
14Name : string;
Title : string;
NELat,
NELng,
SWLat,
SWLng : double;
end;
Voir la demo WFS-WMS-Capabilities-List pour un exemple d'utilisation
'dwd:Niederschlagsradar', // layer
'RADAR' // TECNativeMap group name
);
WMS_Layer_Radar.Version := '1.3.0';
WMS_Layer_Radar.ZIndex := 20;
WMS_layer_Radar.Legend := true;
// opacity 0..100
WMS_layer_Radar.LegendOpacity := 75;
WMS_layer_Radar.LegendPosition := lpRightCenter;
WMS_Layer_Radar.Visible := true;
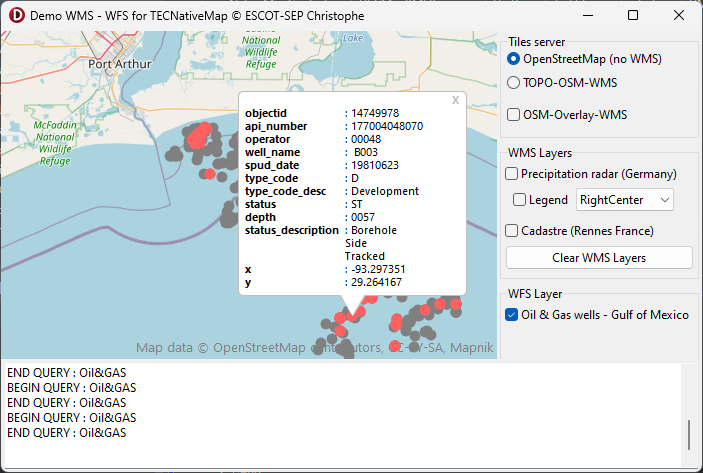
TECOverlayWMS
TECOverlayWMS est une version simplifié de layer WMS qui ne supporte pas les légendes mais qui peut aussi être restreint à une zone rectangulaire fixe.
begin
FECOverlayWMS := TECOverlayWMS.Create(
map,
'https://ows.mundialis.de/services/service', // WMS service url
'OSM-Overlay-WMS', // WMS Layer
'Labels-WMS' // Name of the group containing the overlay, which is a TECShapeMarker
);
(* you can modify after creation
FECOverlayWMS.layers := 'new layers';
FECOverlayWMS.Server := 'new server';
*)
//Triggered just before the call to the WMS server
//If the image is already in the cache, then the event does not occur.
FECOverlayWMS.OnBeforeLoad := doBeforeLoad;
// Triggered when image has been retrieved either from cache or from WMS server
FECOverlayWMS.onLoad := doLoad;
ckOverlay.Checked := true;
ckLinkedMap.Checked := true;
tkOpacity.Position := FECOverlayWMS.Opacity;
map.TileServer := tsArcGisWorldImagery; // in uecMapUtil
end;
procedure TFormWMS.doBeforeLoad(Sender: TObject);
begin
info.Caption := 'Loading...';
end;
procedure TFormWMS.doLoad(Sender: TObject);
begin
info.Caption := '';
end;
// The overlay is link to the visible area of the map or not
procedure TFormWMS.ckLinkedMapClick(Sender: TObject);
begin
(*
When LinkToMapArea = true,
the overlay is automatically updated when the map changes location.
*)
FECOverlayWMS.LinkToMapArea := ckLinkedMap.Checked;
lbSelect.Visible := not ckLinkedMap.Checked;
if lbSelect.Visible then
map.DragRect := drSelect
else
map.DragRect := drNone;
end;
// triggered by selecting a rectangular area with the mouse
procedure TFormWMS.mapMapSelectRect(Sender: TObject; const SWLat, SWLng, NELat,
NELng: Double);
begin
FECOverlayWMS.Bounds(NELat,NELng,SWLat,SWLng);
end;
procedure TFormWMS.ckOverlayClick(Sender: TObject);
begin
FECOverlayWMS.Visible := ckOverlay.Checked;
end;
procedure TFormWMS.tkOpacityChange(Sender: TObject);
begin
FECOverlayWMS.Opacity := tkOpacity.Position;
end;
Layer WFS
La propropriété WFSLayers du composant TECNativeMap vous permet de gérer une lise de layer WFS
Ces layers possèdent eux aussi un tableau permettant d'accéder à l'ensemble des features disponible.
property FeatureTypeList : TAECRecordFeaturesFType : string;
Name : string;
Title : string;
NELat,
NELng,
SWLat,
SWLng : double;
end;
Voir la demo WFS-WMS-Capabilities-List pour un exemple d'utilisation
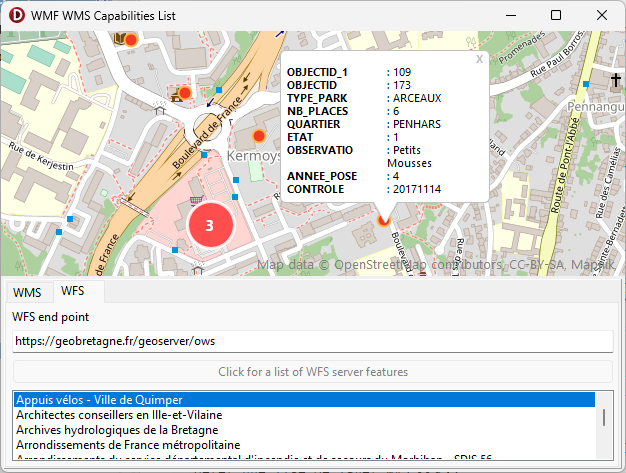
Le service WFS doit pouvoir exporter au format JSON pour que TECNativeMap puisse l'interpréter !
2...
WFS_Layer_Us := map.WFSLayers.Add(
'https://geoserver.geoplatform.gov/geoserver/ngda/ows', // url service
'ngda:473c080c_8686_41d6_b1ee_6945e5c924f3' // layer
,'US-STATICAL-AREA' // TECNativeMap group name
);
// respond to a click on a layer element
WFS_Layer_Us.OnShapeClick := doShapeClick;
// default values for polygones
map.Styles.addRule('#US-STATICAL-AREA.polygone {weight:1;color:black;}');
// when a polygon is hovered over with the mouse, the outline thickness is 3 pixels
// the fill color is red
map.Styles.addRule('#US-STATICAL-AREA.polygone:hover {weight:3;hcolor:red;}');
// polygons with an 'lsad' property value of 'M1' are greyed out
map.Styles.addRule('#US-STATICAL-AREA.polygone.lsad:M1 {fcolor:gray;hbcolor:light(gray)}');
// polygons with an 'lsad' property value of 'M2' are blue
map.Styles.addRule('#US-STATICAL-AREA.polygone.lsad:M2 {fcolor:blue;hbcolor:light(blue)}');
WFS_Layer_Us.MaxFeature := 10000;
// Limit queries to the area bounded by the North-East and South-West corners
// NELat = 50 , NELng = -63
// SWLat = 31 , SWLng = -121
// To accept requests for the whole world (default) : WFS_Layer_Us.BoundingBox;
WFS_Layer_Us.BoundingBox(50,-63,31,-121) ;
// No query if zoom > 10
WFS_Layer_Us.MaxZoom := 10;
// Round off the search area on the corners of the tiles,
// this will allow caching and limit requests to the server.
WFS_Layer_Us.RoundBoxToTiles := true;
// Each time the map is moved, the new zone is queried (taking into account the various limits).
WFS_Layer_Us.AutoRefresh := true;
WFS_Layer_Us.visible := true;
// respond to a click on a layer element
procedure TFormWMS_WFS.doShapeClick(sender: TObject; const item: TECShape);
var Key, Value, content: string;
win: TECShapeInfoWindow;
begin
if not assigned(item) then exit;
content := '';
// extract all properties and their values,
// enriching them for a more readable display
if item.PropertiesFindFirst(Key, Value) then
begin
repeat
// if necessary line break
if content<>'' then content := content+'<br>';
// align the values to 100 pixels
Key := Key + '<tab=100>';
// Bold the keys
content := content + '<b>' + Key + '</b>: ' + Value ;
// continue as long as there are properties
until item.PropertiesFindNext(Key, Value);
end;
if content='' then exit;
// retrieve the WFSLayer stored in the Data property of the clicked element's group
if item.Group.Data is TECNativeWFS then
begin
// we use its infoWindow, but we could use any infoWindow,
// in which case we'd have to ensure that its group ZIndex is greater than that of the WFSLayer
win := TECNativeWFS(item.Group.Data).InfoWindow;
win.content := content;
win.SetPosition(map.MouseLatLng.Lat, map.MouseLatLng.lng);
win.Visible := true;
end;
end;
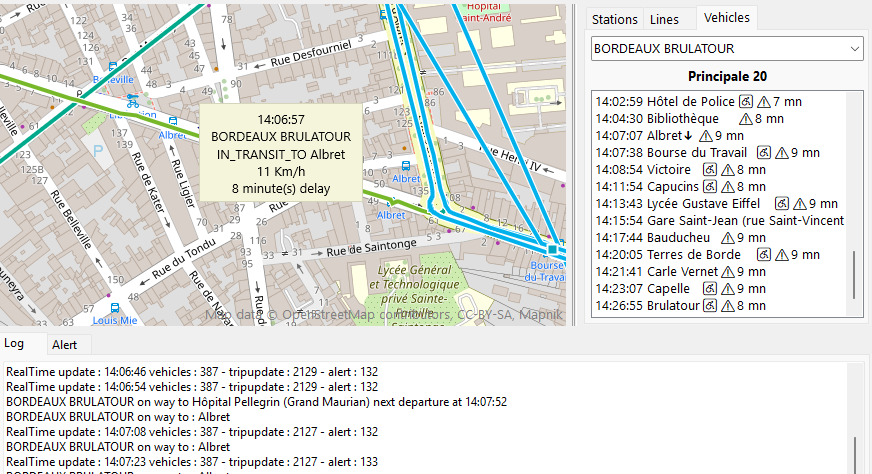
General Transit Feed Specification
GTFS est un format standardisé pour le partage des horaires de transports en commun, le tracé des lignes, la localisation des arrêts.
Vous pourrez travailler avec les fichiers GTFS Shedule (static) et GTFS Real-Time, n'hésitez pas à consulter la documentation technique pour en avoir un aperçu global.
Sur mobilitydatabase.org vous pourrez trouver des flux GTFS
L'unité uecNativeGTFS (FMX.uecNativeGTFS pour Firemonkey) va vous permettre d'utiliser ses informations avec ou sans TECNativeMap.
Le support GTFS n'est disponible qu'à partir de Delphi 10.4
3TGTFS est la classe principale pour gérér ces données.
...
(*
Returns true if this is the first time the files are being opened.
The CSV files will therefore be indexed,
and opening them will take a little longer than subsequent openings,
depending on the size of the CSV files.
*)
function isFirstOpening(const ADirectory: string): boolean;
// Open files, this function is blocking, upon return the files are ready and accessible
// The GTFS archive must be unzipped into its own directory.
// this directory is passed as a parameter.
function OpenDirectory(const ADirectory: string): boolean; overload;
// Open the files by passing a TNotifyEvent procedure.
// The files are opened in the background and do not block the program.
// OnLoad is called when the files are ready to be used.
function OpenDirectory(const ADirectory: string; OnLoad: TNotifyEvent): ITask; overload;
procedure Close;
// find the stop and schedules based on a geographic location, a date and time, and a time range
// use static scheduled times
// files calendar.txt, calendar_dates.txt, stop_times.txt, trips.txt, stops.txt , routes.txt
function getShedule(const Lat, Lng: double; const ADateTime: TDateTime;
const MinutesRange: integer = 30): TAR_Shedules; overload;
// find the stop and schedules based on a StopId, a date and time, and a time range
// use trips.txt, stoptimes.txt , calandar.txt, calendar_dates.txt
function getShedule(const StopId: string; const ADateTime: TDateTime;
const MinutesRange: integer = 30): TAR_Shedules; overload;
// returns all names and IDs of routes that pass through a stop_id
// use stoptimes.txt, trips.txt
function getRoutesFromStopId(const Stop_id: string): TAR_Routes_Name_Id;
// returns all stops of a route
// use realtime feed TripUpdate, trips.txt stoptimes.txt, stops.txt
function getStopsFromRouteId(const Route_Id: string; const Wheelchair_Symbol: boolean = false): TAR_Stops_Name_Id;
// returns all trips of a route
// use trips.txt
function getTripsFromRouteId(const Route_id: string): TAR_Trips_HeadSign_Id;
// Get stops and schedules for Trip_id
// if stop_sequence > -1 then start the list at this stop
// use realtime feed TripUpdate, stoptimes.txt, stops.txt
function getStopTimesFromTrip(const ATrip_id: string; const stop_sequence:integer = -1): TAR_Stop_times;
// Obtain the delay or advance (negative value) for a trip to a stop sequence
// use realtime feed TripUpdate, Stoptimes.txt, stops.txt
function getTripUpdateFromTripAtStopSequence(const ATrip_id: string; const stop_sequence:integer): TR_Stop_times;
// Obtain the delay or advance (negative value) for a trip to a stop sequence
// use realtime feed TripUpdate, Stoptimes.txt, stops.txt
function getTripUpdateFromTripAtStopId(const ATrip_id: string; const Stop_id: string): TR_Stop_times;
// obtain all trips based on geographic location, datetime and hourly range in minutes
// use trips.txt, stoptimes.txt , calandar.txt, calendar_dates.txt
function getTripIds(const Lat, Lng: double; const ADateTime: TDateTime; const MinutesRange: integer = 30):TGTFS_StopIdTripIds; overload;
// obtain all trips based on stops, datetime and hourly range in minutes
// use trips.txt, stoptimes.txt , calandar.txt, calendar_dates.txt
function getTripIds(const AStop_id: string; const ADateTime: TDateTime; const MinutesRange: integer = 30):TGTFS_StopIdTripIds; overload;
// Assignment of API keys for different feeds in the form of key:value added to the request header
procedure setApiKeyMultiFeed(const Key, Value: string);
procedure setApiKeyAlertFeed(const Key, Value: string);
procedure setApiKeyVehiclePositionFeed(const Key, Value: string);
procedure setApiKeyTripUpdateFeed(const Key, Value: string);
// TECNativeMap group containing stops
property MapStops: TECShapes
// TECNativeMap group containing routes
property MapShapes: TECShapes
// TECNativeMap group containing vehicles
property MapRealTime: TECShapes
// access to the main CSV files contained in the GTFS archive
property Routes: TGTFS_Routes
property Trips: TGTFS_Trips
property Stops: TGTFS_Stops ;
property Stop_Times: TGTFS_Stop_Times
property Agency: TGTFS_Agency
property Calendar: TGTFS_Calendar
property Calendar_Dates: TGTFS_Calendar_dates
property Feed_Info: TGTFS_Feed_Info
property Frequencies: TGTFS_Frequencies
property Transfers: TGTFS_Transfers
// Real-time feeds must be in Protocol Buffer format.
// GTFS real-time feed URL; this feed contains VehiclePosition, TripUpdate, and Alert
property UrlMultiFeed: string
// GTFS real-time feed URL; this feed contains only Alert
property UrlAlertFeed: string
// GTFS real-time feed URL; this feed contains only VehiclePosition
property UrlVehiclePositionFeed: string
// GTFS real-time feed URL; this feed contains only TripUpdate
property UrlTripUpdateFeed: string
// List containing TripUpdate messages obtained in the real-time feed
property TripUpdates: TListTripUpdate
// List containing Alert messages obtained in the real-time feed
property Alerts: TListAlert
// List containing VehiclePosition messages obtained in the real-time feed
property Vehicles: TListVehicle
// event triggered when routes are loaded into the map
property OnShapesLoad: TNotifyEvent
// event triggered when stops are loaded into the map
property OnStopsLoad: TNotifyevent
// event triggered when GTFS files are loaded
property OnLoad: TNotifyEvent
// event triggered when one of the real-time feeds has been updated
property OnRealTimeUpdate: TNotifyevent
// response to a click on a route
property OnShapesClick: TOnShapeMouseEvent
// response to a click on a stop
property OnStopsClick: TOnShapeMouseEvent
// response to a click on a vehicle
property OnVehicleClick: TOnShapeMouseEvent
Les fichiers CSV statiques sont gérés au travers de classes dérivées de TGTFS_IndexedCSV_Static, la différence majeure est le champs indexé par défaut
Pour ne pas gaspiller de la mémoire les fichiers CSV ne sont pas chargés intégralement, ils sont lu ligne à ligne.
Un index sur les lignes est généré au premier chargement, un champ est aussi indexé pour accélerer les recherches.
// if the field is not indexed, return 0
// return number of rows
// rows are in SelectRows property
function Select(const AValue: string): integer; overload;
// Retrieves the rows of an indexed field for which the value is passed;
// if the field is not indexed, returns the rows for which the field has this value.
// return number of rows
// rows are in Select property
function Select(const AField, AValue: string): integer; overload;
// Number of lines in the CSV file
function RowCount: integer;
//list containing the lines returned by Select
property SelectRows: TObjectList<TGTFS_CSVRow> ;
// the fields in the CSV file
property Fields: TStringList read getFields;
// Direct access to each row of the CSV file
property Row[Index: integer]: TGTFS_CSVRow ;
TGTFS_CSVRow vous offre un accès aux données d'une ligne
property Datas: TGTFS_ArrayString ;
// the list of fields
property Fields: TStringList read FFields;
// Access to the content of a field either by its name or its index
property Field[Name: string]: string ;
property Field[Index: integer]: string ;
A noter que cette classe dispose d'un Helper pour accéder aux principaux champs directement par leur nom
begin
if Routes.Select(Trips.SelectRows[0].route_id) > 0 then
begin
result[i].Route_Id := Trips.SelectRows[0].route_id;
result[i].Route_Name := Routes.SelectRows[0].route_long_name;
end;
end;
Une démonstration complète est aussi disponible
Le source complet de la démo est sur mon GitHub