TECNativeLayer is the base class of the layers that allow you to react to the displayed area, and mouse actions.
TECNativeLayer = class
private
FObserver : TNativeMapObserver;
FShapes : TECShapes;
FMap : TNativeMapControl;
FOnShapeRightClick,
FOnShapeClick : TOnShapeMouseEvent;
FOnMouseClick,
FOnMouseMove : TNotifyEvent;
function getMinZoom :
byte;
function getMaxZoom :
byte;
procedure
setMinZoom(value:byte);
procedure
setMaxZoom(value:byte);
function getVisible :
boolean;
protected
procedure
doOnMapEndMove(sender : TObject); virtual;
procedure
doOnShapeClick(sender : TObject); virtual;
procedure
doOnShapeRightClick(sender : TObject); virtual;
procedure
doOnMapMouseMove(sender : TObject); virtual;
procedure
doOnMapMouseClick(sender : TObject); virtual;
procedure
doOnMapHiResChange(sender : TObject); virtual;
public
procedure
setVisible(const
value:boolean); virtual;
constructor
Create(_FMap:TnativeMapControl;const Name:string); virtual;
destructor Destroy;
override;
property OnShapeClick :
TOnShapeMouseEvent read
FOnShapeClick write
FOnShapeClick;
property OnShapeRightClick :
TOnShapeMouseEvent read
FOnShaperightClick write
FOnShapeRightClick;
property OnMouseMove :
TNotifyEvent read
FOnMouseMove write
FOnMouseMove;
property OnMouseClick :
TNotifyEvent read
FOnMouseClick write
FOnMouseClick;
property Map :
TNativeMapControl read
FMap;
property Shapes : TECShapes
read FShapes;
property Visible : boolean
read getVisible write setVisible;
property MaxZoom : byte
read getMaxZoom write setMaxZoom;
property MinZoom : byte
read getMinZoom write setMinZoom;
end;
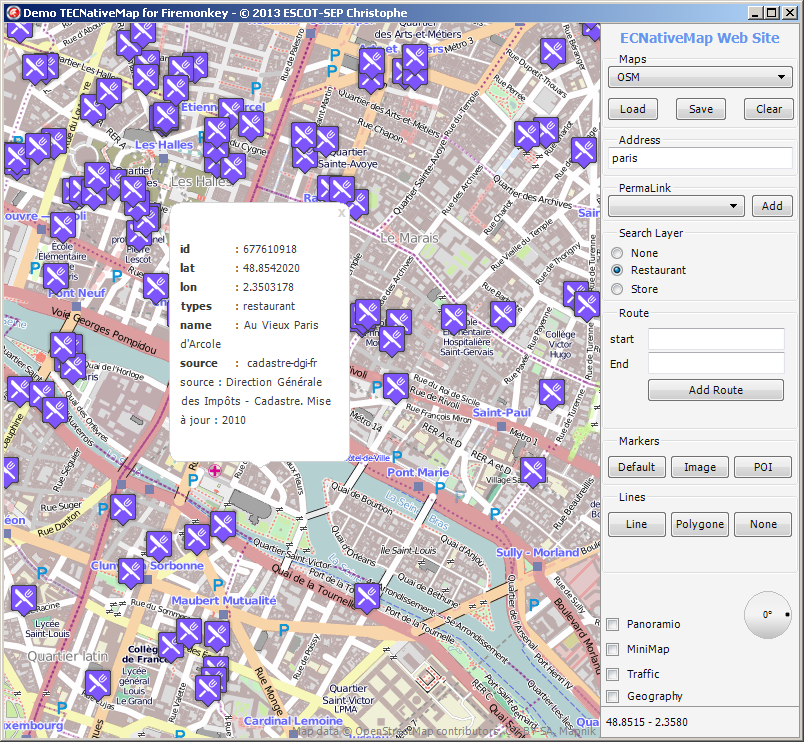
TECNativePlaceLayer
Allows you to automatically display the result of a search
To use this layer you must embed unit uecNativePlaceLayer or FMX.uecNativePlaceLayer depending on whether you use the VCL version or FireMonkey
1Example: a layer that displays restaurants
// search
Layer
FPlacesLayer :=
TECNativePlaceLayer.create(map,'PLACES_LAYER');
FPlacesLayer.OnPLaceClick := doOnPlaceClick;
FPlacesLayer.Visible := true;
FPlacesLayer.Search := 'node[amenity=restaurant]';
// standard image
32x32
FPlacesLayer.MarkerFilename := 'http://www.helpandweb.com/cake_32.png';
// lat,lng on center of
image
FPlacesLayer.XAnchor := 16;
FPlacesLayer.YAnchor := 16;
// hi-res image 64*64
FPlacesLayer.MarkerHiResFilename := 'http://www.helpandweb.com/cake_64.png';
// lat,lng on center of
image
FPlacesLayer.HiResXAnchor := 32;
FPlacesLayer.HiResYAnchor := 32;
...
// event click on place
shape
procedure
TForm1.doOnPlaceClick(sender : TECShape);
var
pResult : TECPlaceResult;
r,
n,
Content : string;
i : integer;
begin
// here Sender and Sender.Item are
allway assigned, and Sender.Item is
TECPlaceResult
pResult :=TECPlaceResult(Sender.item)
for i:=0 to pResult.CountResult-1 do
begin
n := pResult.NameResult[i];
r := pResult.Result[n];
if length(n)<
9 then
n := n+'<tab="65">';
content := content+'<b>'+n+'</b>: '+r+'<br>';
end;
if
FPlacesLayer.Shapes.InfoWindows.Count=0 then
begin
FPlacesLayer.Shapes.InfoWindows.add(0,0,'');
FPlacesLayer.Shapes.InfoWindows[0].zindex := 100;
end;
FPlacesLayer.Shapes.InfoWindows[0].content := Content;
FPlacesLayer.Shapes.InfoWindows[0].SetPosition(Shape.Latitude,shape.Longitude);
FPlacesLayer.Shapes.InfoWindows[0].Visible := true;
end;
end;
By default the elements of layer are TECShapeMarker but you can change the type of TECShape by redefining TECNativePlaceLayer.doCreateShape(SearchResult : TECPlaceResult):TECShape;
XapiLayer
Instead, use the OverPassApi layer
1XapiLayer uses TECNativePlaceLayer and is directly integrated with TECNativeMap.
The search is performed in the area displayed by your map, it is updated on each move
property Shapes:TECShapes
property Search : string
Research is done by doing a query on a server XAPI
You can find all the tags OSM using a syntax like 'node[key=value]'
map.XapiLayer.Search := 'node[highway=bus_stop]';
For nodes you can use simplified syntax.
map.XapiLayer.Search := 'highway=bus_stop';
For the key amenity you can simplify even more.
map.XapiLayer.Search := 'restaurant|bar|cafe';
If you do not specify node in your query the areas will also be displayed.
2To hide them define the style
A point is added to the center of the surfaces, to not display it, add the style
property Visible : boolean
property MaxItem : integer
property OnClick : TOnShape
property OnChange : TNotifyEvent
map.XapiLayer.OnChange := doOnXapiChange;
...
procedure TForm1.doOnXapiChange(sender : TObject);
begin
//
end;
// event click on xapi shape
procedure TForm1.doOnXapiClick(sender : TECshape);
begin
//
end;
Use the styles to decorate your items
map.styles.addRule(Selector+':restaurant' +
'{graphic:base64,iVBORw0KGgoAAAANSUhEUgAAABIAAAAaBAMAAABI' +
'sxEJAAAAGXRFWHRTb2Z0d2FyZQBBZG9iZSBJbWFnZVJlYWR5ccllPAAAABJQTFRFAAAA////AAAAAAA'
+ 'AAAAAAAAA/h6U3wAAAAV0Uk5TAAAQgL++EJOXAAAAOElEQVQY02MIFQ0MFWRUCXVigLBcQ0OgrNDQUH'
+ 'JYQIDOMg0NDYawBIFC2FgCSCxBerFMg0Es02AAP34wMx8/aIAAAAAASUVORK5CYII=;visible:true;');
map.styles.addRule(Selector+':bar' +
'{graphic:base64,iVBORw0KGgoAAAANSUhEUgAAABoAAAAaCAYAAACpSkzOAAAAzklEQVRIx+2WUQ3'
+ 'FIAxFK2ES8HANVMIkIGUOkICESUDCJCABCdtPSQgJC2UjeXlZk3402e1ZoRSIGgZgA3AqfSOtAYgDoK'
+ 'iFmCxWaDLMaEAsoqDQBNGsGlDeHyexnbJPAHwpKuIe9zSwDFzFPR6egM4P9HMgX3YQgDSr67gQrsq51'
+ 'z8ZqqqSwHrOkhsZqguAo0iyS5weL1kD5qZUcjPNfXV1HPIThmaY9vr4QH8KknbPXbfMgtiqvSMA+1Zy'
+ 'lrNy9/SK8g0PVamc2NlTK98F1MyKB+QkmGEAAAAASUVORK5CYII=;visible:true;}');
map.styles.addRule(Selector+':cafe' +
'{graphic:base64,iVBORw0KGgoAAAANSUhEUgAAABoAAAAaCAYAAACpSkzOA'
+ 'AAAuUlEQVRIx2NgIACMjY0F0PgN+OTJBkCD9iMbCsT/cclTYkkCzGCoJfuB+D02eUosKQAZAjIM5nKQ'
+ 'JUBsgE2eEotQDIHyHXDJU2JRPyn8wQmgcfCfTPye1HghGw8/i4D4PBrbgVYWYcMGtLAoAakUmQ8VW0/'
+ 'TOALyFXDGHZUtEqCXRbCy8DzNLAKlNqTMn0ATi0AVI5LYflol7/1I7Pk4a18q5Zv3BKsPKpUMCvQogh'
+ 'RGS2+aW0SzGhYAB5lDXBZ7NtoAAAAASUVORK5CYII=;visible:true;}');
map.styles.addRule('#'+map.XapiLayer.Shapes.Name+ '.marker.highway:bus_stop {color:blue;styleicon:Flat;visible:true;}');
map.styles.addRule('#'+map.XapiLayer.Shapes.Name+ '.marker {scale:1;}');
map.styles.addRule('#'+map.XapiLayer.Shapes.Name+ '.marker:hover {scale:1.5;}');
Way
With way[key = value] you can retrieve paths.
map.XapiLayer.Search := 'way[highway=motorway|primary|secondary|tertiary|residential]';
// styles routes
map.styles.addRule('#' + map.XapiLayer.Shapes.Name +
'.line.highway:primary {zindex:9;weight:4;color:gradient(Red,Yellow,0.3);visible:true;}');
map.styles.addRule('#' + map.XapiLayer.Shapes.Name +
'.line.highway:secondary {zindex:8;weight:3;color:gradient(Red,Yellow,0.4);visible:true;}');
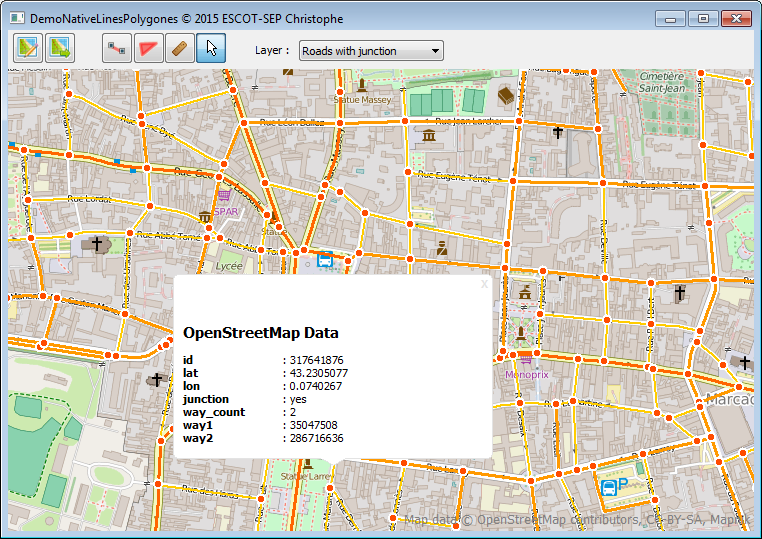
You can also find the junctions between routes.
map.XapiLayer.Search := 'way[highway=unclassified|road|motorway|trunk|primary|secondary|tertiary|residential]';
Manual search
When layer is visible the search is synchronized with the visible area of your map.
To perform a search on any area you need to hide layer and use Bound to delimit the search box.
map.XapiLayer.OnChange := XapiChange;
map.XapiLayer.visible := false;
map.XapiLayer.search := 'highway=bus_stop';
// ! call bound after set search !
map.XapiLayer.bound(43,0.7,44,0.8);
...
TForm.XapiChange(sender : TObject);
begin
// here xapilayer contain openstreetmap data
// copie in another group
map.group[copy_xapi'].ToTxt := map.XapiLayer.shapes.ToTxt;
end;
Mapillary
Only available for Delphi 10.x and higher!
1Mapillary is a service of the same type as Google Street Map, it allows you to display photos at street level, the advantage is that you can enrich it yourself by recording your routes.
TECNativeMap only uses open source information from Mapillary, you need a key to use Mapillary services.
For this go to the site www.mapillary.com, connect, add your applications, you will then get a token which will serve as your access key.
To use mapillary you must incorporate the unit uecMappilary or FMX.uecMappilarydepending on whether you are using the VCL or FireMonkey
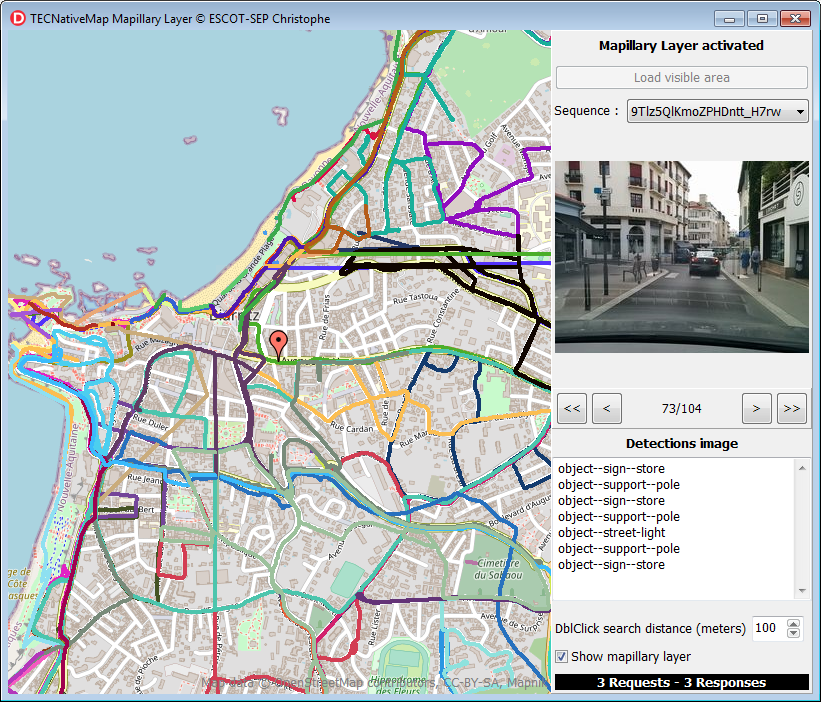
2Use TECMapillaryLayer to display a Mapillary layer.
FMapillaryLayer.OnClick := doOnMapillaryLayerClick;
FMapillaryLayer.OnTrafficSignClick := doOnMapillaryLayerTrafficSignClick;
FMapillaryLayer.OnBeginRequest := doBeginRequest;
FMapillaryLayer.OnendRequest := doEndRequest;
FMapillaryLayer.LocalCache := ExtractfilePath(ParamStr(0)) + 'cache';
FMapillaryLayer.Visible := true;
TECMapillaryLayer
function FindImageClose(const Lat, Lng: double; Distance: integer; var seq : TMapillarySequence; var PhotoIndex : integer ) : integer;
Find the nearest photo among those displayed in the layer, the search is local among the elements displayed on the map.
Lat,Lng indicates the starting point of the search
Distance indicates the maximum distance in meters from the search area
Seq will contain the sequence found or nil
PhotoIndex will contain the index of the picture in seq or -1
Returns the distance in meters between the search point and the photo, 0 if no photo
function SearchImageClose(const Lat,Lng:double; DistanceMeter : integer; ListSequenceImage : TListSequenceImage):integer;
Search all the images included in a radius of DistanceMeter meters, the search is in local
Lat,Lng indicates the starting point of the search
DistanceMeter indicates the maximum distance in meters of the search radius
ListSequenceImage will contain a list of TSequenceImage (a couple sequence, image index)
Returns the number of images found
See the demo MappilarySearchImages for a usage example
3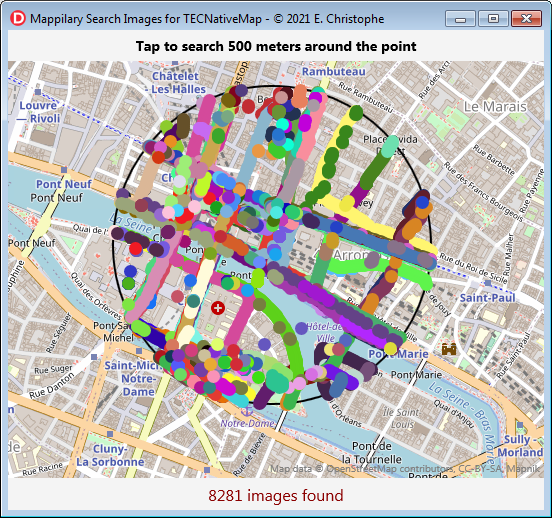
procedure SearchBounds(NorthEastLatitude, NorthEastLongitude, SouthWestLatitude, SouthWestLongitude: double);
function DetectionsImage(const image_id:int64;const List:TListDataDetections):integer;
id,
value,
create_at,
geometry : string;
end;
Fill the list with all the items detected in the image, returns the number of items
L := TListDataDetections.Create;
try
n := FMapillaryLayer.DetectionsImage(SelectedSequence[SelectedImageIndex].Id,L);
Detections.Lines.BeginUpdate;
for i := 0 to n-1 do
Detections.Lines.Add(L[i].value);
Detections.Lines.EndUpdate;
finally
L.Free;
end;
property AccessToken: string ;
property Tiles: TMapillaryTiles
a TMapillaryTile contains a property Sequences : TMapillarySequences which is a list of TMapillarySequence which itself is a list of TMapillaryImage
property Compass_angle: int64 ;
property Lat: double ;
property Lng: double ;
property Sequence_id: string ;
property Organization_id: int64 ;
property Id: int64 ;
property Captured_at: TDateTime ;
property is_Pano: boolean ;
property Url256: string;
property Url1024: string;
property Url2048: string;
end;
there is also a property TrafficSign:TListTrafficSign which is a list of TTrafficSign
id : int64;
First_seen_at,
last_seen_at : TDateTime;
lat,lng : double;
value: string;
end;
procedure Clear;
The data contained in the Tiles are not erased, so there will be no need to reconnect to the mapillary servers to display them again
4procedure ClearAll;
property Visible : boolean
property TrafficSignVisible : boolean
Displays or hides signage
Triggered when clicking on a mapillary image
procedure TForm.doOnMapillaryLayerClick(Layer : TECMapillaryLayer; item : TECShape;
MapillarySequence : TMapillarySequence; ImageIndex : integer);
var bmp:TBitmap;
begin
// show photo in a TImage
bmp := TBitmap.Create;
try
// load image 256*256
// also url1024 and url2048
if FMapillaryLayer.LoadMapillaryBitmap(MapillarySequence[ImageIndex].Url256,bmp) then
Image.Picture.Assign(bmp);
finally
bmp.Free;
end;
end;
Triggered when clicking on a traffic mapillary element
procedure TForm30.doOnMapillaryLayerTrafficSignClick(layer: TECMapillaryLayer; item: TECShape;
ListTrafficSign: TListTrafficSign; TrafficSignIndex: integer) ;
begin
FMapillaryLayer.OpenWindow(item.Latitude,item.Longitude,
'<h4>'+ListTrafficSign[TrafficSignIndex].value+ '</h4><br>'+
'<tab="10"><b>Id</b><tab="40"> : '+IntToStr(ListTrafficSign[TrafficSignIndex].id)+ '<br>'+
'<tab="10"><b>Lat</b><tab="40"> : '+DoubleToStrDigit(ListTrafficSign[TrafficSignIndex].lat, 5)+'<br>'+
'<tab="10"><b>Lng</b><tab="40"> : '+DoubleToStrDigit(ListTrafficSign[TrafficSignIndex].lng, 5),
250 // width=250
);
end;
Allows you to assign a color to a sequence.
By default a unique color is assigned according to the sequence id, so a sequence will always have the same color.
6FMappilaryLayer.AccessToken := 'HERE-YOUR-TOKEN';
FMappilaryLayer.Visible := true;
property OnBeginRequest: TNotifyEvent
property OnEndRequest: TNotifyEvent
procedure TForm.doEndRequest(sender: TObject);
var i,j:integer;
begin
ComboSequences.Items.BeginUpdate;
ComboSequences.items.clear;
for i := 0 to FMapillaryLayer.Tiles.Count-1 do
for j :=0 to FMapillaryLayer.Tiles[i].Sequences.Count-1 do
// store name and TMapillarySequence
ComboSequences.items.addObject(FMapillaryLayer.Tiles[i].Sequences[j].Sequence_id,FMapillaryLayer.Tiles[i].Sequences[j]);
ComboSequences.Items.EndUpdate;
end;
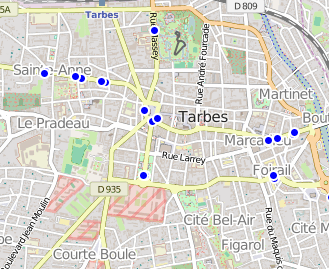
Heatmap
A heat map is used to represent the intensity of data for geographic points.
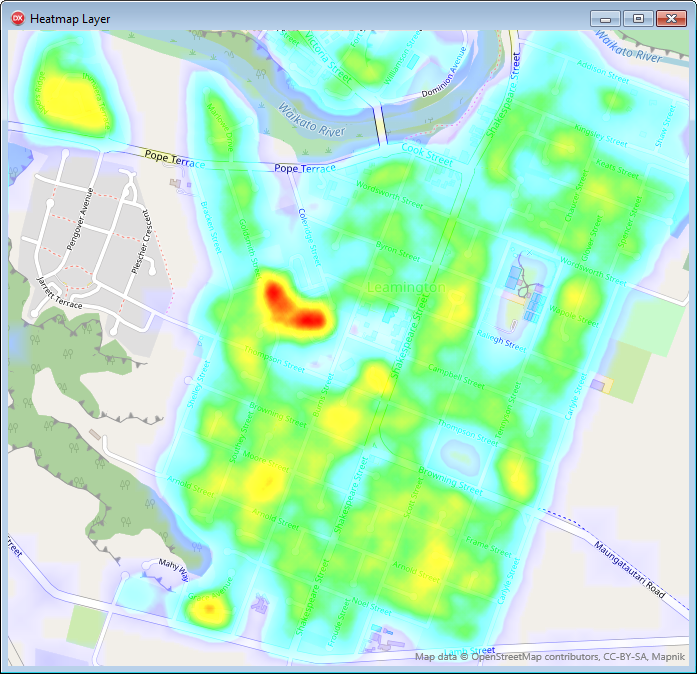
TECHeatmapLayer is the class that allows to manage this type of layer.
constructor Create(_FMap: TECNativeMap);HeatmapLayer := TECHeatmapLayer.Create(map);
procedure Clear;
Erase all of the data
procedure Add(const Latitude, Longitude: double; const value: double = 1);
Add a geographical point and assign it a value, you can make several additions to the same point.
procedure Remove(const latitude, longitude: double; const Value: double);
After adding the points, call Update to refresh the layer
property AutomaticUpdate: boolean
Palette allows you to manage the colors that are used to create the gradient
// addColor(Red,Green,Blue,Value)
// Red,Green, and Blue byte 0..255
// value double 0..1
// this is the default palette, you can also use Palette.reset for recreate it
HeatmapLayer.Palette.AddColor(0,0,0,0); // black for value=0
HeatmapLayer.Palette.AddColor(0,0,255,0.1);// blue for value=0.1
HeatmapLayer.Palette.AddColor(0,255,255,0.25); // cyan for value=0.25
HeatmapLayer.Palette.AddColor(0,255,0,0.5); // green for value=0.5
HeatmapLayer.Palette.AddColor(255,255,0,0.75); // yellow for value=0.75
HeatmapLayer.Palette.AddColor(255,0,0,1); // red for value=1
property Visible: boolean ;
property PointIsDisc : boolean;
Determines if the point is displayed in the form of a disc, otherwise it's a square
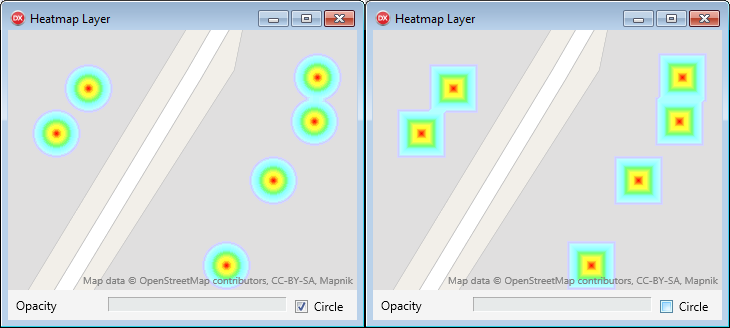
Property Radius:integer;
The point size
Change the opacity of the layer (0 to 100)
Minimum zoom layer to display
property MaxZoom: byte ;
Maximum zoom layer to display
property GroupZIndex: integer ;
ZIndex of the group containing all of the heatmaps, is displayed in ascending order of the ZIndex
property ZIndex: integer ;
ZIndex of the layer compared to the other heatmap
property OnUpdate: TNotifyEvent;
Event fired when the heat map was generated
Weather Layer
By using the services of OpenWeathermap.org you will be able to see overlay layers owPrecipitation, owSnow, owClouds, owPressure, owTemp, owWind// see pressure
map.OpenWeatherTilesLayer.Add(owPressure) ;
// see precipitation
map.OpenWeatherTilesLayer.Add(owPrecipitation) ;
// remove pressure
map.OpenWeatherTilesLayer.remove(owPressure) ;
TomTom Traffic Incidents
Unlike tomtom's incident tiles, this layer allows you to get information about incidents by hovering the mouse or by pressing your finger.
map.TomTom.Key := 'your api key';
map.TomTom.Incident.Layer := true;
TECTomTomIncident
property CategoryLabel : TStringList
You can use it to make a translation but make sure to respect the order and the number of elements
property CacheTime : int64
property Layer : boolean
property InfoStyle : TInfoWindowStyle
property FontColor : TColor
property BorderColor : TColor
property Break : integer
property Tab : integer
property TextDelay : string
property TextLength : string
property TextFrom : string
property TextTo : string
property Width : integer
property YAnchor : integer
property OnClick : TOnShapeMouseEvent
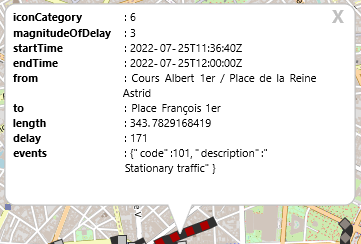
// show all properties
procedure TForm1.doIncidentClick(sender: TObject; const item: TECShape);
var Key, Value, content: string;
win: TECShapeInfoWindow;
begin
content := '';
if item.PropertiesFindFirst(Key, Value) then
begin
repeat
// if necessary line break
if content<>'' then content := content+'<br>';
// align the values to 110 pixels
Key := Key + '<tab=110>';
// Bold the keys
content := content + '<b>' + Key + '</b>: ' + Value ;
// continue as long as there are properties
until item.PropertiesFindNext(Key, Value);
end;
// create window if not exists
if map['info'].InfoWindows.count = 0 then
begin
win := map['info'].AddInfoWindow;
win.Width := 350;
end
else
win := map['info'].InfoWindows[0];
win.content := content;
win.SetPosition(map.MouseLatLng.Lat, map.MouseLatLng.lng);
win.Visible := true;
end;
Styling the information
property Style : string
Contains the styles assigned to the lines.
By default as for tomtom tiles the colors are functions of the magnitude of delay
'#TOMTOM-INCIDENT.line.magnitudeOfDelay:0 {color:#BFBFBF}';
'#TOMTOM-INCIDENT.line.magnitudeOfDelay:1 {color:#F58240}';
'#TOMTOM-INCIDENT.line.magnitudeOfDelay:2 {color:#EB4C13}';
'#TOMTOM-INCIDENT.line.magnitudeOfDelay:3 {color:#AB0000}';
'#TOMTOM-INCIDENT.line.magnitudeOfDelay:4 {color:#8B837D}';
The infoWindow has properties that will allow you to set a style in response
- iconCategory : 0-14 index on the CategoryLabel list
- delay : number of seconds
- length : number of meters
map.Styles.addRule('#TOMTOM-INCIDENT.infowindow{bcolor:light(gray,128);color:white;fontcolor:black}');
// style if the wait is more than 5mn (delay>300)
map.Styles.addRule('#TOMTOM-INCIDENT.infowindow{if:delay>300;bcolor:dark(red,128);color:light(red,96);fontcolor:white}');
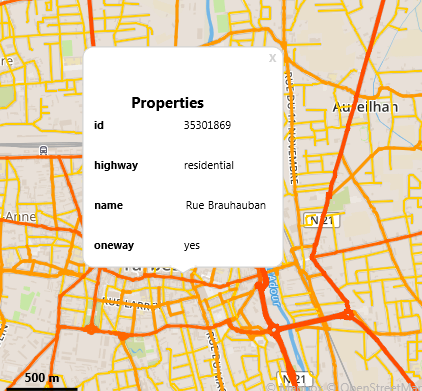
OverPassApi layer
This layer has the same utility as the XAPI layer but it uses OverPassApi which is a newer technology and should therefore be seen as the replacement for the XAPI layer.
The purpose is to extract specific data from OpenStreetMap located in the displayed area of your map, an automatic refresh takes place after each move.
If you define a local cache the searches will be saved there and will be available in offline mode.
7
procedure Amenity(value: string;const Data:TSetOSMData=[odNode,odWay]);
Data indicates if we are looking for the nodes and/or the Ways
procedure Amenity(values: array of string;const Data:TSetOSMData=[odNode,odWay]; const Op: TBinaryFilterOSM = bfOr);
Amenity() procedures are a simplification of Tag() procedures, with a tag_key implicitly equal to "amenity"
8procedure Tag(const key, value: string;const Data:TSetOSMData=[odNode,odWay]);
Data indicates whether to search for Nodes and/or Ways.
procedure Tag(const key:string;const values: array of string;const Data:TSetOSMData=[odNode,odWay]; const Op: TBinaryFilterOSM = bfAnd);
op=bfAnd return tags only if they have all values
op=bfOr selects the tag if it has at least one Value
procedure Tag(const tags: array of string;const Data:TSetOSMData=[odNode,odWay]; const Op: TBinaryFilterOSM = bfAnd);
property Query: string
map.OverPassApi.layer.Tag('highway','residential',[odWay]);
// search Way 'highway'='residential' OR 'highway'='primary'
map.OverPassApi.layer.Tag('highway',['residential','primary'],[odWay],bfOr);
//search Way width highway=residential AND name='Park Avenue'
map.OverPassApi.layer.Tag(['highway','residential','name','Park Avenue'],[odWay],bfAnd);
// search Nodes and Way amenity=parking
map.OverPassApi.layer.Amenity('parking']);
// search only Nodes amenity=restautant or amenity=parking
map.OverPassApi.layer.Amenity(['restaurant','parking'],[odNode]);
// search nodes and ways amenity=parking
map.OverPassApi.layer.Query := 'nw[amenity=parking]';
property Group: TECShapes
property Visible: boolean
property TimeOut: integer
property OnBeginQuery: TNotifyEvent
property OnEndQuery: TNotifyEvent
property OnClick: TOnShapeMouseEvent
property OnData:TECOnOverPassLayerData
map.OverPassApi.Layer.OnEndQuery := doOnEndQuery;
map.OverPassApi.Layer.OnClick := doOnClick;
map.OverPassApi.Layer.OnData := doOnData;
...
// fired when xml data ready
procedure TForm9.doOnData(const XmlValue:string);
begin
XmlData.Lines.Text := XmlValue;
end;
// fired when click on ovepassapi layer item
procedure TForm9.doOnClick(sender: TObject; const item: TECShape);
var Key, Value, content: string;
win: TECShapeInfoWindow;
begin
content := '';
if item.PropertiesFindFirst(Key, Value) then
begin
repeat
// if necessary line break
if content<>'' then content := content+'<br>';
// align the values to 100 pixels
Key := Key + '<tab=100>';
// Bold the keys
content := content + '<b>' + Key + '</b>: ' + Value ;
// continue as long as there are properties
until item.PropertiesFindNext(Key, Value);
end;
// create window if not exists
if map.OverPassApi.Layer.Group.InfoWindows.count = 0 then
begin
win := map.OverPassApi.Layer.Group.AddInfoWindow;
win.Width := 270;
end
else
win := map.OverPassApi.Layer.Group.InfoWindows[0];
win.content := content;
win.SetPosition(map.MouseLatLng.Lat, map.MouseLatLng.lng);
win.Visible := true;
end;
// start query
procedure TForm9.doOnBeginQuery(sender : TObject);
begin
QuerySearch.Visible := true;
end;
// end query
procedure TForm9.doOnEndQuery(sender : TObject);
begin
QuerySearch.Visible := false;
end;
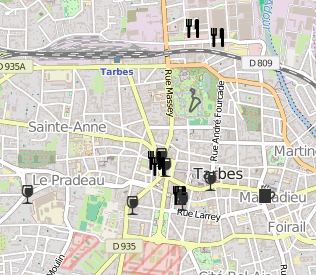
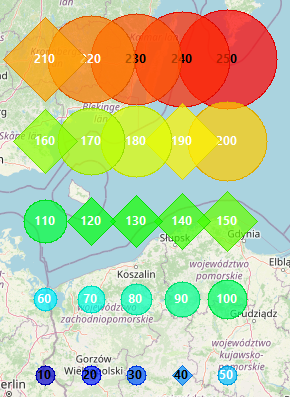
Bubble Layer
A bubble layer displays symbols (circles or other shapes) and possibly labels. Size and color can be controlled by measurements, labels by properties. The position can be specified as a location or as latitude and longitude values.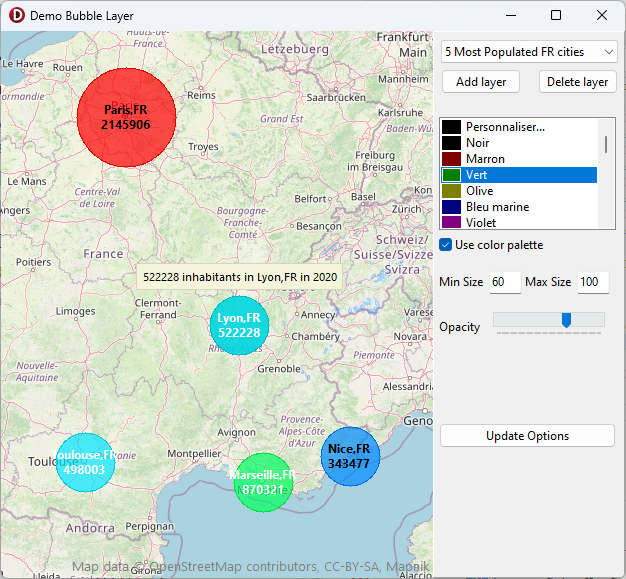
TECBubbleLayers
Layer Manager
function Add(const Name: string): TECBubbleLayer;procedure Delete(const index: integer);
property MinItemSize: integer
property List[const index: integer]: TECBubbleLayer
poiHexagon, poiDiamond, poiText, poiArrow, poiArrowHead, poiCross,
poiDiagCross, poiDirectionSign)
You can find most of its properties at the Layer level, which allows you to centralize them.
9Map.BubbleLayers.OnEditBubble := doOnEditBubble;
Map.BubbleLayers.OnClick := doOnClick;
Map.BubbleLayers.OnRightClick := doOnRightClick;
Map.BubbleLayers.OnChange := doOnChangeLayers;
// click on bubble
procedure TForm.doOnClick(sender: TObject; const item: TECShape);
begin
caption := TECBubbleLayer(sender).Name + ' : ' + item.PropertyFormat(item.Hint);
end;
// right click on bubble
procedure TForm.doOnRightClick(sender: TObject; const item: TECShape);
begin
caption := TECBubbleLayer(sender).Name + ' : ' + item.PropertyFormat(item.Hint)+' (Right)';
end;
// event triggered after the automatic creation
// you can modify your element as you wish, to change its shape and color for example
procedure TForm.doOnEditBubble(const BubbleShape:TECShapePoi);
begin
if BubbleShape['shape']= '1' then
begin
BubbleShape.POIShape := poiDiamond;
BubbleShape.Color := getInvertColor(BubbleShape.color);
end;
end;
// event triggered after add or delete TECBubbleLayer
procedure TForm.doOnChangeLayers(sender : TObject);
begin
Map.BubbleLayers.getLayers(Layers.Items) ;
delete.Enabled := layers.ItemIndex>-1;
end;
TECBubbleLayer
procedure Clear;function Add(const location: string; Size: double;const properties:string=''): TECBubbleItem;
procedure Delete(const index: integer);
procedure fitBounds;
property Color: TColor
property UseColorPalette: boolean
property ColorPalette: THeatPalette
Palette that calculates a color based on the scale of the element
// Red,Green, and Blue byte 0..255
// value double 0..1,
// value corresponds to a percentage
// 0.5 is equivalent to an element that is half the size of the largest
// this is the default palette, you can also use Palette.reset for recreate it
Layer.ColorPalette.AddColor(0,0,0,0); // black for value=0
Layer.ColorPalette.AddColor(0,0,255,0.1);// blue for value=0.1
Layer.ColorPalette.AddColor(0,255,255,0.25); // cyan for value=0.25
Layer.ColorPalette.AddColor(0,255,0,0.5); // green for value=0.5
Layer.ColorPalette.AddColor(255,255,0,0.75); // yellow for value=0.75
Layer.ColorPalette.AddColor(255,0,0,1); // red for value=1
property Count: integer ;
property HintProperty: stringproperty MaxItemSize: integer
property MinItemSize: integer
property Labels: TLabelShape
property Opacity: byte
property shape: TPOIShape
property MaxZoom: byte
property MinZoom: byte
property Name: string
property List[const index: integer]: TECBubbleItem
// in the cumulated it takes time
// the best is to use directly the GPS coordinates
// here it is used for documentation purposes
procedure TForm10.Add_5_Most_Populated_FR_cities;
var FBubbleLayer : TECBubbleLayer;
begin
FBubbleLayer := Map.BubbleLayers.Add('5 Most Populated FR cities');
// Global Hint where the properties of each element will be injected
FBubbleLayer.Hint := '[size] inhabitants in [location] in 2020';
// the color will be determined according to the size using the layer's color palette
FBubbleLayer.UseColorPalette := true;
// the size of the elements will be scaled between 60 and 100 pixels depending on size
FBubbleLayer.MinItemSize := 60;
FBubbleLayer.MaxItemSize := 100;
// labels will be displayed for zoom 5 and more
FBubbleLayer.Labels.MinZoom := 5;
// the label will be composed of the properties 'location' and 'size'
FBubbleLayer.Labels.LabelMask := '[location]'+#13#10+'[size]';
FBubbleLayer.Labels.LabelType := ltMask;
// the position is determined by their location
// its size by the number of inhabitants
FBubbleLayer.Add('Paris,FR',2145906);
FBubbleLayer.Add('Marseille,FR',870321);
FBubbleLayer.Add('Lyon,FR',522228);
FBubbleLayer.Add('Toulouse,FR',498003);
FBubbleLayer.Add('Nice,FR',343477);
// Add('location',size) automatically sets the 'location' and 'size' properties
// you can add properties with these two syntaxes
// var bubble:TECBubbleItem;
// bubble := FBubbleLayer.Add('Paris,FR',2145906,'prop1=data1,prop2=data2');
// bubble['propx'] := 'datax';
// update of the layer display
FBubbleLayer.Update;
// zoom in to show all elements
FBubbleLayer.fitBounds;
end;
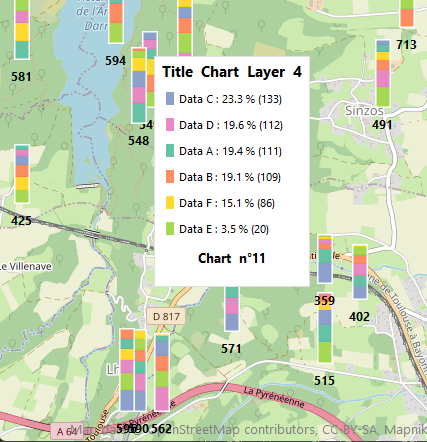
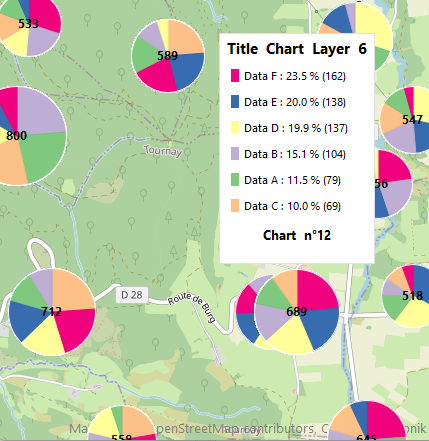
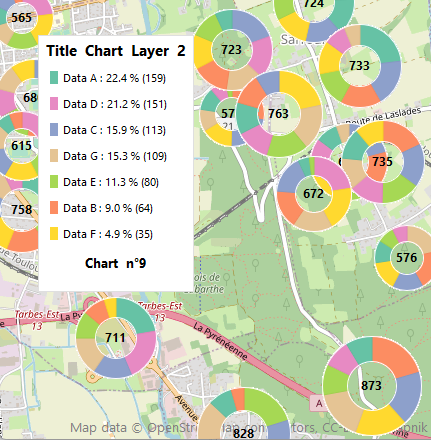
Chart Layer
This layer allows you to display pie charts or stacked bars.
TECChartLayers
TECChartLayer Manager
function Add(const Name: string): TECChartLayer;procedure Delete(const index: integer);
property MinItemSize: integer
property List[const index: integer]: TECChartLayer
You can find most of its properties in the layer, which allows you to centralize them.
10procedure TFormChartLayer.doOnClick(Sender: TObject; const item: TECShape);
begin
caption := 'Click Left - '+TECchartLayer(Sender).Name +
' : Chart n°'+inttostr(item.IndexOf)+' Total =' + item['total'] ;
// if needed you can access TECChartItem with TECChartItem(item.item)
end;
// right click on chart
procedure TFormChartLayer.doOnRightClick(Sender: TObject; const item: TECShape);
begin
caption := 'Click Right - '+TECchartLayer(Sender).Name +
' : Chart n°'+inttostr(item.IndexOf)+' Total =' + item['total'] ;
end;
procedure TFormChartLayer.FormCreate(Sender: TObject);
begin
map.ChartLayers.OnChange := doOnChangeLayers;
map.ChartLayers.OnClick := doOnClick;
map.ChartLayers.OnRightClick := doOnRightClick;
// The size of the diagrams will also be adapted according to the zoom
map.ScaleMarkerToZoom := true;
tag := 0;
TotalLayer := 0;
end;
TECCharLayer
procedure Clear;property BarThickness : integer
property Color: TColor
property BorderColor: TColor
property Count: integerproperty HintColor: TColor
property Labels: TLabelShapeproperty MaxChartSize: integer
property MinChartSize: integer ;
property Opacity: byte
property ChartType: TECChartType
property MaxZoom: byte
property MinZoom: byte
property Visible : boolean
property Name: string
property List[const index: integer]: TECChartItem ;
property ZIndex: integer
property OnClick: TOnShapeMouseEvent
property OnRightClick: TOnShapeMouseEvent
property OnValidHint : TOnValidHint
// palettes from https://colorbrewer2.org
palettes : array [0..2]of array [0..7] of string = (
('#7fc97f','#beaed4','#fdc086','#ffff99','#386cb0','#f0027f','#bf5b17','#666666'),
('#d53e4f','#f46d43','#fdae61','#fee08b','#e6f598','#abdda4','#66c2a5','#3288bd'),
('#66c2a5','#fc8d62','#8da0cb','#e78ac3','#a6d854','#ffd92f','#e5c494','#b3b3b3')
);
// change default hint legend
procedure doOnValideHint(const Sender: TECChartItem; const index: integer;
const percent, value: double; var hint: string);
begin
// a positive index indicates a data line
if index >-1 then
hint := Sender.Layer.Fields[index].Legend + ' : ' + doubletostrdigit(percent,
1) + ' % (' + doubletostr(value) + ')'
else // -1 indicates that the legend is complete, you can enrich it
Hint := '<h3><center>'+sender.Layer.Caption+ '</center></h3>'+
hint+
'<h4><center>Chart n°'+inttostr(sender.Shape.IndexOf)+'</center></h4>';
end;
// create random layer
procedure TFormChartLayer.addLayerClick(Sender: TObject);
var
Lat, Lng: double;
x, y, i,id_pal, delta_lat, delta_lng: integer;
s: string;
FChartLayer: TECChartLayer;
FChartType: TECChartType;
chart: TECChartItem;
begin
// cycle chart type
case tag of
0:
begin
FChartType := ctPie;
s := 'Pie';
end;
1:
begin
FChartType := ctDonut;
s := 'Donut';
end;
2:
begin
FChartType := ctFillDonut;
s := 'FillDonut';
end;
3:
begin
FChartType := ctVerticalStackedBar;
s := 'VerticalStackedBar';
end;
else
begin
FChartType := ctHorizontalStackedBar;
s := 'HorizontalStackedBar';
end;
end;
tag := tag + 1;
if tag>4 then tag := 0;
// create layer
FChartLayer := map.ChartLayers.Add(s + ' ' + timeTosTr(time));
inc(TotalLayer);
FChartLayer.Caption := 'Title Chart Layer ' + inttostr(TotalLayer);
// adapt the graph legend
FChartLayer.OnValidHint := doOnValideHint;
// create random datas
// select palette
id_pal := random(3);
// between 4 and 8 lines of data
for i := 0 to 3 + random(5) do
FChartLayer.AddField('Data ' + chr(i + ord('A')), StrToColor(palettes[id_pal][i]));
FChartLayer.ChartType := FChartType;
// labels will be displayed for zoom 3 and more
FChartLayer.Labels.MinZoom := 3;
if FChartLayer.ChartType < ctVerticalStackedBar then
begin
// max radius 50
FChartLayer.MaxChartSize := 50;
FChartLayer.Labels.Align := laCenter;
end
else // stacked bar
begin
// max bar size 100
FChartLayer.MaxChartSize := 100;
FChartLayer.Labels.Align := laBottom;
end;
FChartLayer.MinChartSize := 16;
// distribute 4 * 4 graphs on the visible surface of the map
delta_lat := round(((map.NorthEastLatitude - map.SouthWestLatitude) * 1000));
delta_lng := round(((map.NorthEastLongitude - map.SouthWestlongitude) * 1000));
for y := 0 to 3 do
begin
for x := 0 to 3 do
begin
Lat := map.SouthWestLatitude + (random(delta_lat) / 1000);
Lng := map.SouthWestlongitude + (random(delta_lng) / 1000);
// create chart
chart := FChartLayer.Add(Lat, Lng);
// add ramdom value
// automatically sets the 'total' propertie
for i := low(FChartLayer.Fields) to High(FChartLayer.Fields) do
chart.data[i] := random(100) + random(99);
end;
end;
// generate the elements on the map
FChartLayer.Update;
// zoom it
FChartLayer.fitBounds;
layers.ItemIndex := layers.Items.Count - 1;
Delete.Enabled := true;
end;
AirQuality
This layer displays the rate of air pollution in the world, it uses data from the projet World Air Quality Index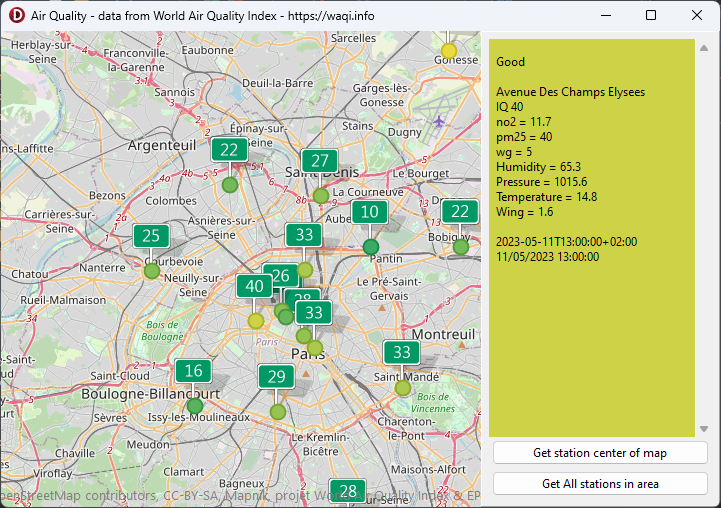
procedure getJSON(const Lat, Lng: double)
procedure getJSON(const city: string)
procedure getJSON(const Lat, Lng, lat2, lng2: double)
The data is returned in JSON format, the OnJson
event is triggered as soon as it is available.
The OnRequest event is triggered when the request is
launched.
function JsonToAirQualityCity(const json:string):TAirQualityCity
Query,
Json,
Name: string;
latitude: double;
longitude: double;
DominantPollutant: TAirQualityItem;
Pollutants: TAirQualityPollutants;
Weather: TAirQualityWeather;
IsoTime: string;
Time: TDateTime;
level: TAirQualityLevel;
LevelColor: TColor;
end;
property AirQualityIndex: TAirQualityIndex
Choice of the main index displayed on the tiles
![]()
By default usepa_aqi which indicates the main pollutant
property Key: string
property Visible: boolean
property City: TAirQualityCity
For the request to be triggered, OnClick or OnHover must be set.
12property OnJson: TAirQualityOnJson
property OnClick : TAirQualityEvent
property OnHover : TAirQualityEvent
property OnRequest : TNotifyEvent
procedure TFormAirQuality.doOnclick(const sender : TAirQualityCity);
var i:integer;
level:string;
begin
// all data in json format are available in sender.Json
MJSon.text := #13#10+ map.AirQuality.Legend[sender.Level]+#13#10#13#10;
MJSon.Lines.Add(Sender.Name);
MJson.Lines.Add('IQ '+DoubleToStr(Sender.DominantPollutant.Value));
for i := 0 to High(sender.Pollutants) do
MJson.Lines.Add(Sender.Pollutants[i].Name+' = '+DoubleToStr(sender.Pollutants[i].value));
for i := 0 to High(sender.weather) do
MJson.Lines.Add(sender.weather[i].Name+' = '+DoubleToStr(sender.weather[i].value));
MJSon.Lines.Add('');
MJSon.Lines.Add(sender.IsoTime);
MJSon.Lines.Add(DateTimeToStr(sender.Time));
MJSon.Color := sender.LevelColor;
MJSon.Font.Color := GetContrastingColor(sender.LevelColor);
end;
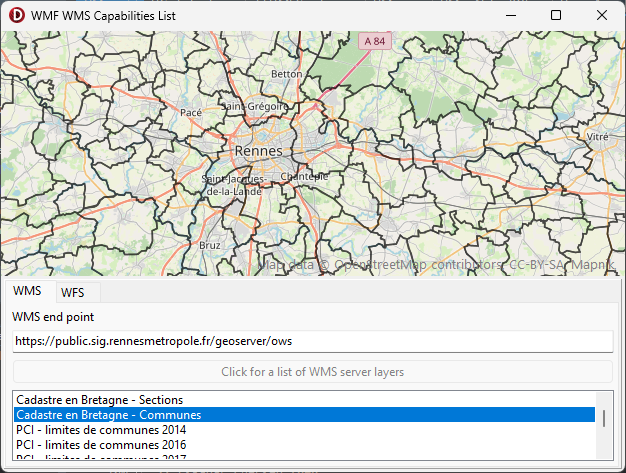
Layer WMS
The WMSLayers property of the TECNativeMap component allows you to manage a WMS layer list.
...
WMS_Cadastre := map.WMSLayers.Add('https://geobretagne.fr/geoserver/cadastre/wms', // url service
'CP.CadastralParcel', // layer
'CADASTRE' // TECNativeMap group name
);
TECWMSLayers
function Count: integer;procedure Refresh;
procedure Clear;
function Add(const Url, layers, Name: string): TECNativeWMS;
procedure Delete(const Name: string);
procedure Delete(const index: integer);
procedure Delete(const index: TECNativeWMS);
function IndexOf(const Name: string): integer;
property Layer[const index: integer]: TECNativeWMS; default
property Layer[const index: string]: TECNativeWMS; default
property OnCapabilities : TNotifyEvent
property OnFeatureInfo : TNotifyEvent
property OnEnabled : TNotifyEvent
property OnChangeTimeDimension
property OnLoadingTimeDimension
...
// event triggered when TimeDimension tiles is loading
procedure TFormWMS_WFS.doOnLoadingTimeDimension(Sender: TObject);
var
WMSLayer: TECNativeWMS;
begin
if Sender is TECNativeWMS then
begin
WMSLayer := Sender as TECNativeWMS;
if assigned(WMSLayer) then
begin
TimeLoading.Position := WMSLayer.LoadingPercentTimeDimension;
TimeLoading.Visible := WMSLayer.LoadingPercentTimeDimension< 100;
end;
end
end;
property OnEnabledTimeDimension
map.WMSLayers.OnCapabilities := doOnCapabilities;
map.WMSLayers.OnFeatureInfo := doOnFeatureInfo;
map.WMSLayers.OnEnabled := doOnEnabled;
map.WMSLayers.OnChangeTimeDimension := doOnChangeTimeDimension;
map.WMSLayers.OnEnabledTimeDimension := doOnEnabledTimeDimension;
...
// OnEnabled is triggered when the visible area of the map moves in or out of the layers.
// When Enabled is false, no more requests are made to the server.
procedure TFormWMS_WFS.doOnEnabled(Sender: TObject);
var
WMSLayer: TECNativeWMS;
begin
if Sender is TECNativeWMS then
begin
WMSLayer := Sender as TECNativeWMS;
if assigned(WMSLayer) then
begin
events.lines.Add(WMSLayer.Name + ' ENABLED : ' +
BoolToStr(WMSLayer.Enabled));
end;
end
end;
// event triggered each time the TimeDimension enabled/disable
procedure TFormWMS_WFS.doOnEnabledTimeDimension(Sender: TObject);
var
WMSLayer: TECNativeWMS;
begin
if Sender is TECNativeWMS then
begin
WMSLayer := Sender as TECNativeWMS;
if assigned(WMSLayer) then
begin
events.lines.Add(WMSLayer.Name + ' TIMEDIMENSION ENABLED : ' +
BoolToStr(WMSLayer.TimeDimension.Enabled));
end;
end
end;
// event triggered each time the TimeDimension period changes
procedure TFormWMS_WFS.doOnChangeTimeDimension(Sender: TObject);
var
WMSLayer: TECNativeWMS;
begin
if Sender is TECNativeWMS then
begin
WMSLayer := Sender as TECNativeWMS;
if assigned(WMSLayer) then
begin
Time.Caption := WMSLayer.Time;
end;
end
end;
// A GetCapabilities request is automatically made to the server,
// when the data is available OnCapabilities is triggered
// and the data is available in the Capabilities string.
// You can restart a request using the GetCapabilities procedure
procedure TFormWMS_WFS.doOnCapabilities(Sender: TObject);
var
WMSLayer: TECNativeWMS;
begin
if Sender is TECNativeWMS then
begin
WMSLayer := Sender as TECNativeWMS;
if assigned(WMSLayer) then
begin
// show Bounding Box
events.lines.Add(WMSLayer.Name + ' BBOX :' +
doubletoStrDigit(WMSLayer.SWLat, 6) + ' ' +
doubletoStrDigit(WMSLayer.SWLng, 6) + ' ' +
doubletoStrDigit(WMSLayer.NELat, 6) + ' ' +
doubletoStrDigit(WMSLayer.NELng, 6));
end;
end
end;
// A GetFeatureInfo request is automatically made to the server,
// when the data is available OnFeatureInfo is triggered
// and the data is available in the FeatureInfo string.
// You can restart a request using the GetFeatureInfo procedure
procedure TFormWMS_WFS.doOnFeatureInfo(Sender: TObject);
var
WMSLayer: TECNativeWMS;
begin
if Sender is TECNativeWMS then
begin
WMSLayer := Sender as TECNativeWMS;
if assigned(WMSLayer) then
begin
events.lines.Add('GET FEATUREINFO : ' + WMSLayer.Name);
end;
end
end;
TECNativeWMS
property Capabilities: string;They are retrieved in a Thread, the event TECWMSLayers.OnCapabilities is activated when they are available.
They are retrieved in a Thread, the event TECWMSLayers.OnFeatureInfo is activated when they are available.
Allows you to specify a date in ISO 8601 string format.
Leave blank for latest data
// set Minute and seconde to 0
datetime := SetHourMinuteSeconde(Now, -1, 0, 0);
// show last hour
WMS_Layer_Radar.TimeDimension.StartTime := decHour(datetime, 1);
WMS_Layer_Radar.TimeDimension.EndTime := datetime;
// period 5 minutes
WMS_Layer_Radar.TimeDimension.PeriodMillisecondes := 5 * 60 * 1000;
WMS_Layer_Radar.TimeDimension.TransitionMillisecondes := 500;
// You can also directly pass an array of TDateTime
// WMS_Layer_Radar.TimeDimension.AddTime([datetime1, datetime2,..,datetimex]);
// loop
WMS_Layer_Radar.TimeDimension.Loop := true;
// activate timedimension
WMS_Layer_Radar.EnabledTimeDimension := true;
procedure StartTimeDimension;
procedure EndTimeDimension;
procedure NextTimeDimension;
procedure PrevTimeDimension;
property PauseTimeDimension: boolean
property LegendHeight: integer
property LegendOpacity: byte
TECRecordLayer array containing information on the layers available on the server. This array is filled after the call to getCapabilities, so you can access it as soon as OnCapabilities has been triggered.
getCapabilities is automatically called when the layer is created.
14Name : string;
Title : string;
NELat,
NELng,
SWLat,
SWLng : double;
end;
See WFS-WMS-Capabilities-List for an example of use
'dwd:Niederschlagsradar', // layer
'RADAR' // TECNativeMap group name
);
WMS_Layer_Radar.Version := '1.3.0';
WMS_Layer_Radar.ZIndex := 20;
WMS_layer_Radar.Legend := true;
// opacity 0..100
WMS_layer_Radar.LegendOpacity := 75;
WMS_layer_Radar.LegendPosition := lpRightCenter;
WMS_Layer_Radar.Visible := true;
TECOverlayWMS
TECOverlayWMS is a simplified version of layer WMS that does not support legends but can also be restricted to a fixed rectangular area.
begin
FECOverlayWMS := TECOverlayWMS.Create(
map,
'https://ows.mundialis.de/services/service', // WMS service url
'OSM-Overlay-WMS', // WMS Layer
'Labels-WMS' // Name of the group containing the overlay, which is a TECShapeMarker
);
(* you can modify after creation
FECOverlayWMS.layers := 'new layers';
FECOverlayWMS.Server := 'new server';
*)
//Triggered just before the call to the WMS server
//If the image is already in the cache, then the event does not occur.
FECOverlayWMS.OnBeforeLoad := doBeforeLoad;
// Triggered when image has been retrieved either from cache or from WMS server
FECOverlayWMS.onLoad := doLoad;
ckOverlay.Checked := true;
ckLinkedMap.Checked := true;
tkOpacity.Position := FECOverlayWMS.Opacity;
map.TileServer := tsArcGisWorldImagery; // in uecMapUtil
end;
procedure TFormWMS.doBeforeLoad(Sender: TObject);
begin
info.Caption := 'Loading...';
end;
procedure TFormWMS.doLoad(Sender: TObject);
begin
info.Caption := '';
end;
// The overlay is link to the visible area of the map or not
procedure TFormWMS.ckLinkedMapClick(Sender: TObject);
begin
(*
When LinkToMapArea = true,
the overlay is automatically updated when the map changes location.
*)
FECOverlayWMS.LinkToMapArea := ckLinkedMap.Checked;
lbSelect.Visible := not ckLinkedMap.Checked;
if lbSelect.Visible then
map.DragRect := drSelect
else
map.DragRect := drNone;
end;
// triggered by selecting a rectangular area with the mouse
procedure TFormWMS.mapMapSelectRect(Sender: TObject; const SWLat, SWLng, NELat,
NELng: Double);
begin
FECOverlayWMS.Bounds(NELat,NELng,SWLat,SWLng);
end;
procedure TFormWMS.ckOverlayClick(Sender: TObject);
begin
FECOverlayWMS.Visible := ckOverlay.Checked;
end;
procedure TFormWMS.tkOpacityChange(Sender: TObject);
begin
FECOverlayWMS.Opacity := tkOpacity.Position;
end;
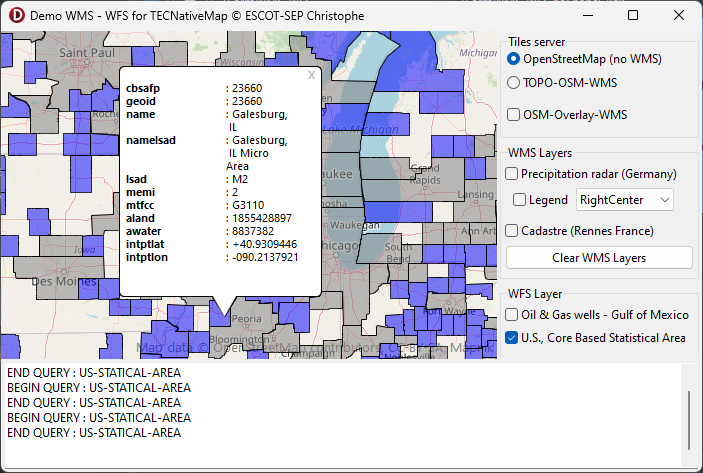
Layer WFS
The WFSLayers property of the TECNativeMap component allows you to manage a WFS layer layer.
These layers also have a table giving access to all available features..
property FeatureTypeList : TAECRecordFeaturesFType : string;
Name : string;
Title : string;
NELat,
NELng,
SWLat,
SWLng : double;
end;
See WFS-WMS-Capabilities-List for an example of use
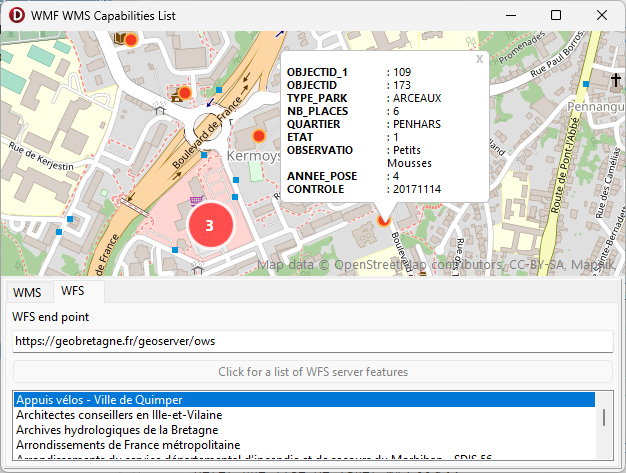
The WFS service must be able to export in JSON format so that TECNativeMap can interpret it!
2...
WFS_Layer_Us := map.WFSLayers.Add(
'https://geoserver.geoplatform.gov/geoserver/ngda/ows', // url service
'ngda:473c080c_8686_41d6_b1ee_6945e5c924f3' // layer
,'US-STATICAL-AREA' // TECNativeMap group name
);
// respond to a click on a layer element
WFS_Layer_Us.OnShapeClick := doShapeClick;
// default values for polygones
map.Styles.addRule('#US-STATICAL-AREA.polygone {weight:1;color:black;}');
// when a polygon is hovered over with the mouse, the outline thickness is 3 pixels
// the fill color is red
map.Styles.addRule('#US-STATICAL-AREA.polygone:hover {weight:3;hcolor:red;}');
// polygons with an 'lsad' property value of 'M1' are greyed out
map.Styles.addRule('#US-STATICAL-AREA.polygone.lsad:M1 {fcolor:gray;hbcolor:light(gray)}');
// polygons with an 'lsad' property value of 'M2' are blue
map.Styles.addRule('#US-STATICAL-AREA.polygone.lsad:M2 {fcolor:blue;hbcolor:light(blue)}');
WFS_Layer_Us.MaxFeature := 10000;
// Limit queries to the area bounded by the North-East and South-West corners
// NELat = 50 , NELng = -63
// SWLat = 31 , SWLng = -121
// To accept requests for the whole world (default) : WFS_Layer_Us.BoundingBox;
WFS_Layer_Us.BoundingBox(50,-63,31,-121) ;
// No query if zoom > 10
WFS_Layer_Us.MaxZoom := 10;
// Round off the search area on the corners of the tiles,
// this will allow caching and limit requests to the server.
WFS_Layer_Us.RoundBoxToTiles := true;
// Each time the map is moved, the new zone is queried (taking into account the various limits).
WFS_Layer_Us.AutoRefresh := true;
WFS_Layer_Us.visible := true;
// respond to a click on a layer element
procedure TFormWMS_WFS.doShapeClick(sender: TObject; const item: TECShape);
var Key, Value, content: string;
win: TECShapeInfoWindow;
begin
if not assigned(item) then exit;
content := '';
// extract all properties and their values,
// enriching them for a more readable display
if item.PropertiesFindFirst(Key, Value) then
begin
repeat
// if necessary line break
if content<>'' then content := content+'<br>';
// align the values to 100 pixels
Key := Key + '<tab=100>';
// Bold the keys
content := content + '<b>' + Key + '</b>: ' + Value ;
// continue as long as there are properties
until item.PropertiesFindNext(Key, Value);
end;
if content='' then exit;
// retrieve the WFSLayer stored in the Data property of the clicked element's group
if item.Group.Data is TECNativeWFS then
begin
// we use its infoWindow, but we could use any infoWindow,
// in which case we'd have to ensure that its group ZIndex is greater than that of the WFSLayer
win := TECNativeWFS(item.Group.Data).InfoWindow;
win.content := content;
win.SetPosition(map.MouseLatLng.Lat, map.MouseLatLng.lng);
win.Visible := true;
end;
end;