To use the shapes you need to add the unit uecNativeShape
All the elements positioned on the map are accessible through the property Shapes type TECShapes or another group through map['group_name'], they descend all the class TECShape
You can store in your elements (marker, poi, line or polygon) the textual data you want through the PropertyValue property, its values will be able to be associated to a style
...
M := Map.addMarker(map.latitude,map.Longitude);
M.PropertyValue['my_tag']:='value_tag';
// you can also use
M['my_tag']:='value_tag';
// groups can also have them
map.shapes['tag']:='value';
map['group']['tag']:='value';
when you add several items, use BeginUpdate / EndUpdate, otherwise the map is redrawn after each addition.
1// for
optimisation
map.shapes.BeginUpdate;
map.Shapes.Markers.add(lat1,lng1);
map.shapes.Markers.add(lat2,lng2);
...
map.shapes.EndUpdate;
var G:TECShapes;
...
G := map['group_name'];
G.BeginUpdate;
G.Markers.add(lat1,lng1);
G.Markers.add(lat2,lng2);
...
G.EndUpdate;
Styles
Instead of manually decorate each element you can define rules to apply a style
Groups ( TECShapes )
A group maintains a set of elements, the Shapes property is the default group, you go to a group by the Group ['name'] property
You can access groups with the syntax map['name'] instead of map.Group['name']
2You can also be accessed by an index through the property Groups
1var
my_group:TECShapes;
// for optimisation
my_group := map.Group['group1'];
my_group.BeginUpdate;
my_group.Markers.add(lat1,lng1);
my_group.Markers.add(lat2,lng2);
...
my_group.EndUpdate;
Pois, markers, lines and polygons properties also have a fitBounds procedure
2The OnLoad event is raised when the content is fully available
3Charge the group with a stream that contains data in the OSM XML format or olt
Charge the group with a string containing data at the OSM XML format or olt
String that is displayed as a tooltip for elements with empty Hint
map['groupx'].Hint := 'value of [prop1] - value of [prop2]';
Active support of Clusters, This allows you to group markers and pois who are near for better visibility
property Pois: TECShapePOIList
The lists have an iterator as groups
3// Iterator
for all list of shapes (markers, pois, lines, polygones
and infowindows )
var poly :
TECShapePolygone;
for poly in
map.shapes.polygones do
begin
poly.color := clRed;
end;
You also have shortcuts to create your elements
4function addMarker(const Lat, Lng: double) : TECShapeMarker;
function AddPOI(const Lat, Lng: double) : TECShapePOI;
function AddLine: TECShapeLine;
function AddEncodedLine(const EncodedLine: string; const precision: byte = 5): TECShapeLine;
function AddLine(const dLatLngs: array of double): TECShapeLine;
function AddLine(const dLine: TECShapeLine) : TECShapeLine;
function AddPolygone : TECShapePolygone;
function AddPolygone(const dLine: TECShapeLine): TECShapePolygone;
function AddEncodedPolygone(const EncodedLine: string; const precision: byte = 5): TECShapePolygone;
function AddPolygone(const dLatLngs: array of double): TECShapePolygone;
my_line : TECShapeLine;
my_poly : TECShapePolygone;
my_group : TECShapes;
...
my_group := map['my_group'];
my_marker := my_group.addMarker(lat,lng);
my_line := my_group.addLine([lat1,lng1,...,latx,lngx]);
my_poly := my_group.addPolygone(my_line);
property MaxZoom: byte
The opacity varies from 0 to 100, a value >100 indicates that the opacity of the group is not taken into account, only that of the elements is used.
In the case of a value > 100, the original opacity of the elements is not restored
1TECNativeMap.TopGroupZindex Returns the highest ZIndex of all groups
4The elements also have a clickable property
5Does not apply if we directly backup group
6
map.Group['group1'].Serialize := true;
map.Group['group2'].Serialize := false;
map.SaveToFile(filename); //
group2 not save
Lists of elements (Markers, Pois, Lines, Polygons) also have a Show property that you can activate/deactivate individually.
7
Returns true if at least one of the elements of the group is selected.
Lists of items also have a Selected property
8map['test'].markers.Selected := true;
// selects all pois of test group
map['test'].pois.Selected := true;
// selects all lines of test group
map['test'].lines.Selected := true;
// selects all polygones of test group
map['test'].polygones.Selected := true;
property Name: string
Markers and Pois HeatMap
Marker and Pois lists have HeatMap properties to manage a heat map.
map.BeginUpdate;
// new group
G := map['GroupTest'];
G.markers.heatmap.MaxZoom := 15;
(*
Above MaxZoom markers are displayed,
below MaxZoom the HeatMap is displayed.
When HeatMap is displayed, elements continue to react
to the mouse (Hint, Click...) even if they are not visible.
*)
// You can modify the palette
// G.markers.heatmap.Palette.Clear;
// G.markers.heatmap.Palette.addColor(Red,Green,Blue,Value)
// Radius of HeatMap points
G.markers.heatmap.Radius := 10;
dy := (map.NorthEastLatitude - map.SouthWestLatitude) / 2;
dx := (map.NorthEastLongitude - map.SouthWestlongitude) / 2;
// add 10000 markers
for y := 0 to 9999 do
begin
Lat := map.latitude - dy + (random(round(dy*2 * 1000)) / 1000);
Lng := map.longitude - dx + (random(round(dx*2 * 1000)) / 1000);
M := G.Markers.AddMarker(Lat,Lng);
// the 'weight' of each element is defined and used to create the HeatMap
weight := random(1000);
M['weight'] := inttostr(weight);
M.Hint := 'marker '+inttostr(y)+' : weight '+inttostr(weight);
end;
(*
HeatMap generation,
the 'Weight' property of the elements is used to calculate the HeatMap
If you leave empty they will all weigh 1
*)
G.markers.heatmap.update('weight');
G.markers.heatmap.visible := true;
// Optimization: map refresh restored
map.EndUpdate;
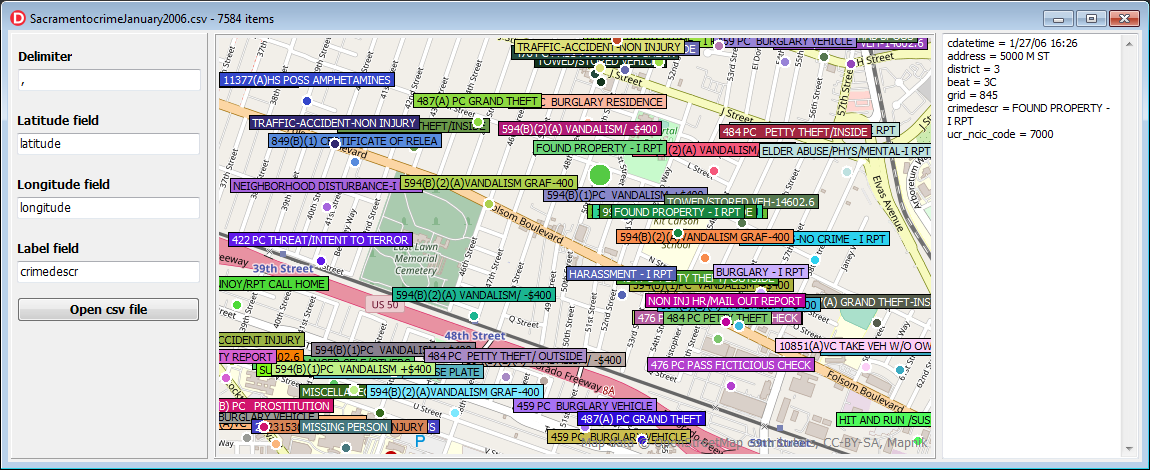
CSV
The CSV file manager is accessible through the CSV property groups
function LoadFromFile(const filename: string):boolean;When the data is loaded the OnLoad event of the map is triggered
9procedure SaveToFile(const filename: string;const ShapeList:TECShapeList);
Saves the list of elements (markers or Pois) in a csv file
Use the Fields list to select the PropertyValue to save.Fields contains the fields from the last loaded CSV file so if necessary empty it before filling it with your selection.
No need to add fields for Latitude and Longitude, FieldNameLatitude and FieldNameLongitude will be used
map.Shapes.CSV.Fields.add('street');
map.Shapes.CSV.Fields.add('zip');
map.Shapes.CSV.SaveToFile(filename,map.shapes.Markers);
property FieldNameWKT: string;
// save the geometry of elements in WKT format, essential for lines and polygons.
// for this you must fill in the field FieldNameWKT
map.shapes.csv.FieldNameWKT := 'WKT';
map['group'].csv.FieldNameWKT := 'WKT';
map.shapes.savetofile('filename.csv');
map['group'].savetofile('filename.csv');
property FieldNameLatitude: string;
If the geographic position is grouped in a single field, specify it in FieldNameLatitude, leave FieldNameLongitude blank, use DelimiterLatLng to define the separator between latitude and longitude.
5map.Shapes.CSV.FieldNameLongitude := '';
map.Shapes.CSV.DelimiterLatLng := ',';
property idxLatitude: integer
// you can indicate directly the index of the fields containing the latitude and longitude
// You must also empty FieldNameLatitude and FieldNameLongitude
map.Shapes.CSV.FieldNameLatitude := '';
map.Shapes.CSV.FieldNameLongitude := '';
map.Shapes.CSV.idxLatitude := 10;
map.Shapes.CSV.idxLongitude := 11;
property Delimiter : char
map.shapes.CSV.OnFilterCSV := doOnFilterCSV;
...
// valid csv data , default true
procedure TForm.doOnFilterCSV(const Data: TStringList;var validCSV:boolean);
begin
if (data.Count>2) and (pos('POLYGON',data[7])< 1) then
validCSV := (data[2]<>'relation');
end;
property OnCreateCSVPoint: TOnCreateCSVPoint
map.shapes.CSV.OnCreateCSVPoint := doOnCreateCSVPoint;
...
// Manual creation of each point
// Data contains the CSV values for the point
procedure TForm.doOnCreateCSVPoint(const Group: TECShapes; var CSVPoint: TECShape; const Lat, Lng: double; const Data:TStringList) ;
var M:TECShapeMarker;
begin
// create new marker
M := Group.addMarker(lat,lng);;
CSVPoint := M ;
// marker design
M.Width := 12;
M.StyleIcon := siFlat;
// we calculate its color according to its index number
M.Color := GetHashColor(inttostr(M.IndexOf));
end;
property OnCreateWKTObject : TOnCreateWKTObject
map.shapes.CSV.OnCreateWKTObject := doOnCreateWKTObject;
map['group'].CSV.OnCreateWKTObject := doOnCreateWKTObject;
// fired after creation wkt object
procedure TForm.doOnCreateWKTObject(const Group: TECShapes;
const WKTObject: TECShape; const Lat, Lng: double; const Data: TStringList);
begin
// we calculate its color according to its index number
if WKTObject is TECShapePolygone then
TECShapePolygone(WKTObject).FillColor := GetHashColor(inttostr(WKTObject.IndexOf))
else
WKTObject.Color := GetHashColor(inttostr(WKTObject.IndexOf));
end;
The geometry must be expressed in decimal degrees, if needed you can connect to OnConvertLatLng to define a conversion procedure
1// you can connect to OnConvertLatLng to convert
// sample
procedure ConvertLatLng(var lat,lng:double);
begin
Lat := Lat / 1000000;
Lng := Lng / 1000000;
end;
procedure TForm.FormCreate(Sender: TObject);
begin
map.shapes.CSV.OnConvertLatLng := ConvertLatLng;
end;
The other fields of the CSV file are imported into the
elements through their property PropertyValue[field_name]
:= field_value
If the CSV file does not name its fields, they will be
named by concatenating the file name without the
extension + the field index
Labels
The Polygones, Markers and Pois lists allow you to associate labels to their elements, you can access them through the Labels properties.
property Align: TLabelShapeAlignproperty BorderColor: TColor
property ColorType: TLabelShapeColorType
Setting graphic properties
lcShape (default) item color and font will be usedlcColor color and Font will be set by the Color and FontXXX properties
lcProperty uses element properties (item['fontcolor'],item['fillcolor'],item[ 'bordercolor'],item['shadowcolor'],item[ 'shadowsize'])
property FontColor: TColor
When ColorType=lcShape the color of the font is either White or Black depending on the best contrast.
10property FontBold: boolean
property FontItalic: boolean
property FontSize: integer
property FontFamily: string
property LabelType: TLabelShapeType
number of decimals used for latitude and longitude display, default 3
You can display several properties by placing them between []
// [location] and [size] are replaced by the content of these properties
map.shapes.markers.Labels.LabelMask := '[location]'+#13#10+'[size]';
Set 0 (default value) so that all the text is displayed
property ShowOnlyIf : TLabelShowOnly (default lsoAll)
Filter the display of labels
Possibilities : lsoAll,lsoSelected,lsoPressed,lsoHover,lsoFocused,lsoEdited
map.shapes.markers.labels.ShowOnlyIf := lsoPressed;
on mobile lsoHover is identical to lsoPressed
11In Firemonkey, text is surrounded by a border of color ShadowColor and size ShadowTextOffset.
12
map.group['groupX'].Pois.Labels.Visible := true;
map.Shapes.Markers.Labels.LabelType := ltHint;
// the text can be multi-line
map.Shapes.Markers[0].hint := 'Text label'+#13# 10+'line 2';
map.group['groupX'].Pois.Labels.LabelType := ltProperty;
map.group['groupX'].Pois.Labels.LabelProperty := 'lb_voie_ext';
map.group['groupX'].Pois[0].PropertyValue['lb_voie_ext'] := 'text label';
// By default the background color is the color of the element, use ColorType to set another color.
map.shapes.Markers.Labels.ColorType := lcColor; // default lcShape
map.shapes.Markers.Labels.Color := clRed;
Labels for lines
The points of the lines consist of markers or pois, so you can activate the display of labels.
By default they are markers, to use pois see OnCreateShapeLinePoint
13Reminder the points are only displayed if you fill in their Text property which correspond to the Hint of the labels..
...
if map.shapes.lines.count>0 then
begin
line := map.shapes.lines[0];
for i:=0 to line.count-1 do
line.path[i].Text := 'Point '+inttostr(i);
end;
Add Shapes
You can use the following shortcuts to add your items
function TNativeMapControl.AddPOI(const Lat, Lng: double; const GroupName: string = ''): TECShapePOI;function TNativeMapControl.AddMarker(const Lat, Lng: double; const GroupName: string = ''): TECShapeMarker;
function TNativeMapControl.AddLine(const Lat, Lng: double; const GroupName: string = ''): TECShapeLine;
...
// create line
line := map.addLine(lat,lng);
// use this syntax for add line in group
// line := map.addLine(lat,lng,'your group');
// don't free ! or use remove
// line.remove
// to find your item in the list use indexof
// map.shapes.lines[line.indexof]
// map.group['your group'].lines[line.indexof]
// block repaint
line.beginupdate;
// add more points in line
line.add(lat2,lng2);
line.add(lat3,lng3);
// now of for repaint
line.endupdate;
...
// create line
line := map.addLine([lat,lng,lat2,lng2,lat3,lng3]);
// use this syntax for add line in group
// line := map.addLine([lat,lng,lat2,lng2],'your group');
// block repaint, no need with addline but now yes
line.beginupdate;
// add more points in line
line.add(lat4,lng4);
line.add(lat5,lng5);
// now of for repaint
line.endupdate;
function TNativeMapControl.AddPolygone(const dLatLngs: array of double; const GroupName: string = ''): TECShapePolygone;
function TNativeMapControl.AddInfoWindow(const Lat, Lng: double; const GroupName: string = ''): TECShapeInfoWindow;
Do not destroy this shapes, they are kept in their respective group lists
2TECClusterManager
The following properties allow you to change the display of the clusters
Watch demoNativePOI to understand how to use clusters
14property Style : TClusterStyle (csEllipse, csStar, csRect, csTriangle,csTriangleDown ,csHexagon, csDiamond,csCategories)
csCategories allows you to count element types within the cluster
15Add a category and set its color
The last category will be used to integrate all items that do not correspond to the criteria of the other categories.
// To use another group, replace map.shapes with map['group_name'].
FClusterGroup := map.shapes;
// Categories are determined by the value of the 'shape' property of the elements.
FClusterGroup.ClusterManager.CategorieKey := 'shape';
// Each type of POI is referenced as a category,
// The color is calculated according to the name to maintain consistency.
with FClusterGroup.ClusterManager do
begin
// for poi['shape']='Ellipse'
AddCategorie('Ellipse', GetHashColor('ellipse'));
AddCategorie('Star', GetHashColor('etar'));
AddCategorie('Triangle', GetHashColor('triangle'));
AddCategorie('Diamond', GetHashColor('diamond'));
AddCategorie('Hexagon', GetHashColor('hexagon'));
AddCategorie('Arrow', GetHashColor('arrow'));
AddCategorie('ArrowHead', GetHashColor('arrowhead'));
AddCategorie('Cross', GetHashColor('cross'));
AddCategorie('DiagCross', GetHashColor('diagcross'));
AddCategorie('DirectionSign', GetHashColor('directionsign'));
AddCategorie('Rect', GetHashColor('rect'));
AddCategorie('Text', GetHashColor('text'));
// The last category will be used to count non-referenced categories.
// Here it's useless, but it's for documentation purposes.
AddCategorie('Other', GetHashColor('Other'));
end;
property BorderColor : TColor
property BorderSize : integer
property FontSize : integer
property Opacity : byte
property WidthHeight : integer
property FillClusterList : boolean
You can access it at the OnMouseOverCluster event ( Cluster.shapes )
Items that are less than MaxPixelDistance of a cluster are grouped, 60 pixels by default
Displays the clusters while moving the map defaults to true
If the zoom is greater than MaxZoom elements are not grouped, default 18
Raised when an item is added in a cluster, you can refuse by toggling cancel to true, default false
var Color:TColor;var BorderColor:TColor;var TextColor:TColor,
var WidthHeight,FontSize:integer)
Raised before the display to allow you to adjust properties
If you connect on this event you are supporting fully the cluster design
Triggered by the entry of the mouse on the cluster
Triggered by the release of the mouse in the cluster
example, change color depending on the number of elements contained by the cluster
// if you need to manipulate the elements contained in the cluster set FillClusterList a true
map.Shapes.ClusterManager.FillClusterList := true;
map.Shapes.ClusterManager.OnColorSizeCluster := doOnColorSizeCluster;
procedure TForm.doOnColorSizeCluster(const Cluster : TECCluster;
var Color:TColor;var BorderColor:TColor;var TextColor:TColor;
var WidthHeight,FontSize:integer;
var CCluster : TClusterStyle
);
//var i, nbrSelected: integer;
begin
// sample code if you need to manipulate the elements contained in the cluster
(*
nbrSelected := 0;
for i := 0 to Cluster.shapes.count - 1 do
begin
if Cluster.shapes[i].selected then
inc(nbrSelected);
end;
*)
if Cluster.Count< 10 then
begin
Color := clGreen;
end
else
if Cluster.Count< 100 then
begin
Color := clBlue;
end
else
Color := clRed;
end;
See also the VCL demo / Cluster aggregate average values
Element TECShape
All displayable elements are descended from TECShape, they share the following properties
property Clusterableallows not group this elements, true by default
property Address: string
Geolocated the element, equivalent to Address but is not blocking
Raises OnShapeLocation(item:TECShape,GeoResult:TECGeoResult;const Valid:boolean);
If the TECShape is not OnShapeLocation event is the OnShapeLocation of its Group that is raised.
Valid is true if the current position of the element is the same as that at the research.
map.shapes.OnShapeLocation :=
doShapeLocation;
// Asynchronous search address
for Markers[0],
// when it is found
map.shapes.OnShapeLocation is triggered
map.shapes.Markers[0].Location;
//
procedure
TForm1.doShapeLocation(item:TECShape;const
GeoResult:TECGeoResult;const Valid:boolean);
begin
if assigned(item)
and Valid then
begin
// address
GeoResult.address;
end;
end;
function DistanceTo(Shape:TECShape)
procedure InfoWindow(const content:string);
procedure InfoWindow(window:TECShapeInfoWindow);
Add an infoWindow to the element, it appears when you click on the element.
// you can also use one infoWindow for many shapes
id := map.shapes.infoWindows.add(0,0,'the same for all');
my_marker1.InfoWindow(map.shapes.infoWindows[id]);
my_marker2.InfoWindow(map.shapes.infoWindows[id]);
// for delete use nil
my_marker3.InfoWindow(nil);
procedure Remove
procedure SetPosition(const dLat, dLng: double)
Moves the element x kilometres at an angle expressed in degrees
If you wish to use the Vincenty formula, pass true as the last parameter .
function IndexOf: integer
function ShowOnMap: boolean
property Animation : TECShapeAnimation
property Longitude: double
property Altitude: double
property Color: TColor
property HoverColor: TColor
procedure setFocus;property Tag: longint
property Visible : boolean
If TrackLine is set the track of the movement of the element will be generated
To activate it, simply use the property, you can also directly assign a line
// To activate the trace just access TrackLine
// line is created in the same group as FTracker
FTracker.TrackLine.visible := true;
// You can also pass a line
FTracker.TrackLine := your_line;
// for stop tracking set to nil , the line is free
FTracker.TrackLine := nil
If you test directly TrackLine it is automatically created if it does not exist !
16property Serialize : boolean
property Clickable
property ZIndex
Show element in foreground regardless of ZIndex
A single item at a time may be in the foreground, BringToFront does not change the display order which remains dependent of the ZIndex
17property Draggable
By switching the TNativeMapControl.ShapeDragMode property to sdmMultiShapes (default sdmShape) and if the element pointed by the mouse is selected you will be able to move all the draggable selected elements simultaneously, they will keep the same distances between them.
property XAnchor and YAnchor
Available for TECShapeMarker and TECShapePOI
3property Hint: string
You can inject the properties of the element like this
The text may be enriched with some html tags see TECShapeInfoWindow
6You can use PropertyValue to store your own data, this property is also used by vector tiles, the OpenStreetMap data is saved.
18property Group:TECShapes
Selects item, selected item appears as if it was over
The Selected property of the map contains all selected items// you can
use Iterator
var shape:TECShape
for shape in map.Selected
do
begin
..
end;
TECSelectedShapesList
Type of the list of selected items, gives you access tofunction ByArea(const NEALat,NEALng,SWALat,SWALng :double):integer;
function count : integer;
procedure SaveToFile(const filename:string);
property Item[index: integer]: TECShapeResearch
You have several functions to search in your items
function FindShapeByArea(const SWALat, SWALng, NEALat, NEALng: double;
                        const ShapeList: TList<TECShape>;
                        const FilterShapes : TNativeShapes = [];
                        Filter:TOnShapeFilter=nil): integer;
ShapeList filled with items in a rectangular area which indicates the Southwest corners and Northeast
FilterShapes allows you to filter the wanted elements, by default all, example [nsMarker,nsPoi] to search only for TECShapeMarker and TECShapePOI
Filter allows to add a procedure to filter the search
map.FindShapeByKMDistance(map.Latitude,map.Longitude, 2.0,liste,[nsMarker,nsPoi],FilterCafe);
...
procedure FilterCafe(const Shape: TECShape; var cancel: boolean);
begin
cancel := shape.PropertyValue['kind']<>'cafe' ;
end;
function FindShapeByKMDistance(const FLat, FLng, FKMDistance: double;
                                const ShapeList: TList<TECShape>;
                                const FilterShapes : TNativeShapes = [];
                                Filter:TOnShapeFilter=nil): integer;
function FindShapeByFilter(const ShapeList: TList<TECShape>;
                                const FilterShapes : TNativeShapes;
                                Filter:TOnShapeFilter): integer;
All these functions return the number of items found.
19For Delphi versions that do not support generics ShapeList is a simple TList
20Events
Forms trigger the following events :
property OnShapeMove : TOnShapeMove
property OnShapeDrag : TOnShapeMove
property OnShapeDragEnd : TNotifyEvent
property OnShapeMouseOver : TOnShapeMouseEvent
property OnShapeMouseOut : TOnShapeMouseEvent
property OnShapeMouseDown : TOnShapeMouseEvent
property OnShapeMouseup : TOnShapeMouseEvent
property OnShapeClick : TOnShapeMouseEvent
property OnShapeRightClick: TOnShapeMouseEvent
property OnShapeDblClick : TOnShapeMouseEvent
property OnShapeDblClick : TNotifyEvent
property OnShapeLocation : TOnShapeLocation
Events can be assigned individually to each element, in this case they are not passed to the level of TECNativeMap
7Snap markers on a line or a polygon
You can set the TECShapeMarker and TECShapePOI which will automatically gravitate towards a TECShapeLine or a TECShapePolygone if the drop has some distance from these.
Manage you this through the SnapDrag of type TECSnapDrag of the mapping component TECNativeMap property.
procedure ClearMarker;Returns true if the element is added.
Returns true if the element is added.
true to meters, false (default) to pixels.
map.SnapDrag.AddGuide(poly);
map.SnapDrag.AddGuide(red_line);
map.SnapDrag.MeterDistance := true;
map.SnapDrag.SnapDistance := 50; // 50 meters
map.SnapDrag.MeterDistance := false;
map.SnapDrag.SnapDistance := 50; // 50 pixels
The property _snap_ of the guides is set to true when it attracts a marker, you can use to define a style that will visually report the status.
8map.Styles.addRule('.line._snap_:true {scale:2}') ;
map.Styles.addRule('.polygone._snap_:true {scale:2}') ;
// default size
map.Styles.addRule('.line._snap_:false {scale:1}') ;
map.Styles.addRule('.polygone._snap_:false {scale:1}') ;
// doted target line
map.Styles.addRule('#TECSnapDrag.line{penStyle:Dot}');
If you want that markers are attracted to specific lines, you can create your own variable of type TECSnapeDrag
9...
MySnapDrag := TECSnapDrag.create;
MySnapDrag.addMarker(mrk);
MySnapDrag.AddGuide(poly);
MySnapDrag.AddGuide(red_line);
...
MySnapDrag.free
Drawing and free hand selection
FreeHand allows you to define lines, which can become polygons, to mouse, for it simply activate FreeHand.Draw
map.FreeHand.OnDraw := doFreeHandDraw;
// activate the hands-free drawing
map.FreeHand.Draw := true;
...
procedure TForm.doFreeHandDraw(Sender: TObject);
begin
// save the line to your map
map.addLine(TECNativeFreeHand(sender).line)
// you can use also this syntax
map.FreeHand.addLine;
// convert the drawn line into a polygon and add it to the map
map.addPolygone(TECNativeFreeHand(sender).line);
// you can use also this syntax
map.freeHand.addPolygone;
end;
You can also activate the free hand selection tool, allows you to choose items simply by surrounding
property AutomaticMapMovement : boolean ;
Allows the automatic card moving when the drawing cursor approaches an edge, default True
property Draw: boolean ;
The drawing mode.
property Selection: boolean ;
property MouseButton: TMouseButton ;
The mouse button used to draw, by default mbRight.
If you use the left button, it map may be moved by holding down the CTRL key.
10property Cursor: TECShape ;
Drawing slider, by default a TECShapePOI in the shape of a cross.
property Line: TECShapeLine;
The line that represents your drawing, you can adjust its properties either directly or by style.
map.Styles.addRule('#TECNativeFreeHand.Line {color : green;penStyle:Dash;weight:2}') ;
property PolygoneSelection: TECShapePolygone ;
Accessible in the OnSelection event, it represents the area of your selection.
property SelectionList: TECShapesList;
Accessible in the OnSelection event, this list contains selected items.
map.FreeHand.OnPermission := doOnFreeHandPermission;
...
// selection with freeHand is only allowed if CTRL or SHIFT is pressed
procedure TForm1.doOnFreeHandPermission(sender : TObject;var valid:boolean);
begin
valid := (((GetKeyState(VK_CONTROL) and $8000) = $8000) or
((GetKeyState(VK_SHIFT) and $8000) = $8000)
);
end;
property SelectionFilter: TOnShapeFilter
Can set a filter for selection.
...
// select only cafe
procedure FilterCafe(const Shape: TECShape; var cancel: boolean);
begin
cancel := shape.PropertyValue['kind']<>'cafe' ;
end;
function AddLine(const GroupName:string=''):TECShapeLine;
function AddPolygone(const GroupName:string=''):TECShapePolygone;
SelectArea
This property allows you to select a rectangular or circular area.
property AreaType: TECAreaType ;
property Area: double
property Width: double
property Height: double
property Color : TColor
procedure setPosition(const Lat,Lng:double)
procedure Boundary(const dNELat, dNELng, dSWLat, dSWLng: double)
procedure fitBounds
property Center : TLatLng
property NELat: double
property NELng: double
property SWLat: double
property SWLng: double
property Visible: boolean
property ShowMetrics : boolean
property OnChange: TNotifyEvent
property OnClick: TNotifyEvent
property OnDblClick: TNotifyEvent
property OnLongPress: TNotifyEvent
property OnRightClick: TNotifyEvent
property OnUpdateMetric : TOnUpdateMetric
begin
map.SelectArea.OnChange := doOnChange;
map.SelectArea.OnUpdateMetric:= doUpdateMetric;
map.SelectArea.Visible := true;
end;
procedure TFSelectArea.doUpdateMetric(const sender: TECSelectArea; var Value: string);
begin
// display only area
value := 'Area : '+doubletostrdigit(map.SelectArea.Area, 3)+' Km²';
end;
procedure TFSelectArea.doOnChange(sender : TObject);
begin
case map.SelectArea.AreaType of
atRectangle: begin
info.Caption := 'NorthEst : '+ doubletostrdigit(map.SelectArea.NELat,3)+','+
doubletostrdigit(map.SelectArea.NELng,3)+' SouthWest : '+
doubletostrdigit(map.SelectArea.SWLat,3)+','+
doubletostrdigit(map.SelectArea.SWLng,3)+
' W : '+doubletostrdigit(map.SelectArea.Width, 2)+' Km '+
'H : '+doubletostrdigit(map.SelectArea.Height, 2)+' Km '+
'Area : '+doubletostrdigit(map.SelectArea.Area, 3)+' Km²';
end;
atCircle: begin
info.Caption := 'Lat : '+ doubletostrdigit(map.SelectArea.Center.lat,3)+','+
doubletostrdigit(map.SelectArea.Center.lng,3)+' Radius : '+
doubletostrdigit(map.SelectArea.Width / 2,2)+' Km Area : '+doubletostrdigit(map.SelectArea.Area, 3)+' Km²';
end;
end;
end;
Grids
This property manages grids that you can place on your map, the grids can be rectangular or delimited by a polygon.
function Add(const col, row: integer;const GridName: string = '') : TECGrid;
function Add(const Poly: TECShapePolygone;const CellSizeMeter: integer = 500; const GridName: string = ''): TECGrid;
// add a 5x3 grid
grid := Map.Grids.Add(5,3,'grid 5x3');
// create a grid on a polygon with cells of 1Km by 1Km
grid := Map.Grids.Add(Map['groupx'].Polygones[1],1000);
property Grid[index: integer]: TECGrid default;
property Grid[index: string]: TECGrid default;
grid := Map.Grids[1];
// get a grid by his name
grid := Map.Grids['grid 2'];
// grid = nil if not exists
property OnCellDblClick: TOnCellEvent
property OnCellRightClick: TOnCellEvent
property OnCellLongPress: TOnCellEvent
map.grids.OnCellRightClick := doGridRightClick;
map.grids.OnHeaderClick := donOnHeaderClick ;
map.grids.OnCellClick := doCellClick;
map.grids.OnCelldblClick := doCellDblClick;
map.grids.OnCellLongPress := doCellLongPress;
map.Grids.OnEditChange := doOnEditChange;
map.Grids.OnChange := doChangeGrids;
...
procedure TForm8.doFocusedGrid(Sender: TObject);
begin
// here sender = map.grids.FocusedGrid
if assigned(map.grids.FocusedGrid) then
begin
col.Value := map.grids.FocusedGrid.col;
row.Value := map.grids.FocusedGrid.row;
end;
end;
procedure TForm8.doOnEditChange(const Grid:TECGrid);
begin
info.Caption := (
'NorthEst : '+ doubletostrdigit(Grid.NELat,3)+' , '+doubletostrdigit(Grid.NELng,3)+
' SouthWest : '+doubletostrdigit(Grid.SWLat,3)+' , '+doubletostrdigit(Grid.SWLng,3)+
' - Col : '+inttostr(Grid.col)+' Row : '+inttostr(Grid.row));
end;
// click on labels
procedure TForm8.donOnHeaderClick(const Grid:TECGrid;const Text:string;const index: integer; const Position : TECHeaderLabelPosition) ;
var PosText:string;
begin
case Position of
hlpTop : PosText := 'Top';
hlpBottom: PosText := 'Bottom';
hlpLeft : PosText := 'Left' ;
hlpRight : PosText := 'Right';
end;
info.Caption := (Text + ' - Index : '+inttostr(index)+' Pos : '+PosText);
end;
procedure TForm8.doCellClick(const Grid:TECGrid; const Item: TECShapePolygone);
begin
info.Caption := ('Click '+Item.Description+ ' - Col:'+ Item['cell-col']+' Row:'+Item['cell-row']);
end;
procedure TForm8.doCellDblClick(const Grid:TECGrid; const Item: TECShapePolygone);
begin
info.Caption := ('DblClick '+Item.Description+ ' - Col:'+ Item['cell-col']+' Row:'+Item['cell-row']);
end;
procedure TForm8.doCellLongPress(const Grid:TECGrid; const Item: TECShapePolygone);
begin
info.Caption := ('Press '+Item.Description+ ' - Col:'+ Item['cell-col']+' Row:'+Item['cell-row']);
Grid.editable := true;
end;
procedure TForm8.doGridRightClick(const Grid:TECGrid; const Item: TECShapePolygone);
begin
info.Caption := ('RightClick '+Item.Description+ ' - Col:'+ Item['cell-col']+' Row:'+Item['cell-row']);
end;
property OnHeaderColLabel: TOnHeaderLabel
property OnHeaderRowLabel: TOnHeaderLabel
map.Grids.OnHeaderColLabel := doOnHeaderColLabel;
map.Grids.OnHeaderRowLable := doOnHeaderRowLabel;
...
procedure TForm.doOnHeaderColLabel(const index:integer;var value:string) ;
begin
value := inttostr(index);
end;
//
procedure TForm.doOnHeaderRowLabel(const index:integer;var value:string) ;
begin
value := NumberToAlphabet(index); // unit uecMapUtil
end;
TECGrid
This class manages a grid
procedure setPosition(const Lat, Lng: double);const aCellSizeMeter: integer);
property Name: string
property NELat: double
property NELng: double
property SWLat: double
property SWLng: double
ZIndex of the grid
property toTxt: string